In the heart of our digital world, chatbots have become a fixture.
Most of us have run into them when meandering through the web or trying to get quick customer support.
But—
What’s American customers’ take on chatbots? Do we love them, OR the human touch is still preferred?
Our survey of 1,000+ internet users sheds some light on the matter.
Key Takeaways
- About 93% of American customers have interacted with a chatbot in the past 24 months.
- Businesses that use chatbots are generally seen as more trustworthy in the eyes of the public, particularly Gen Zers (67%).
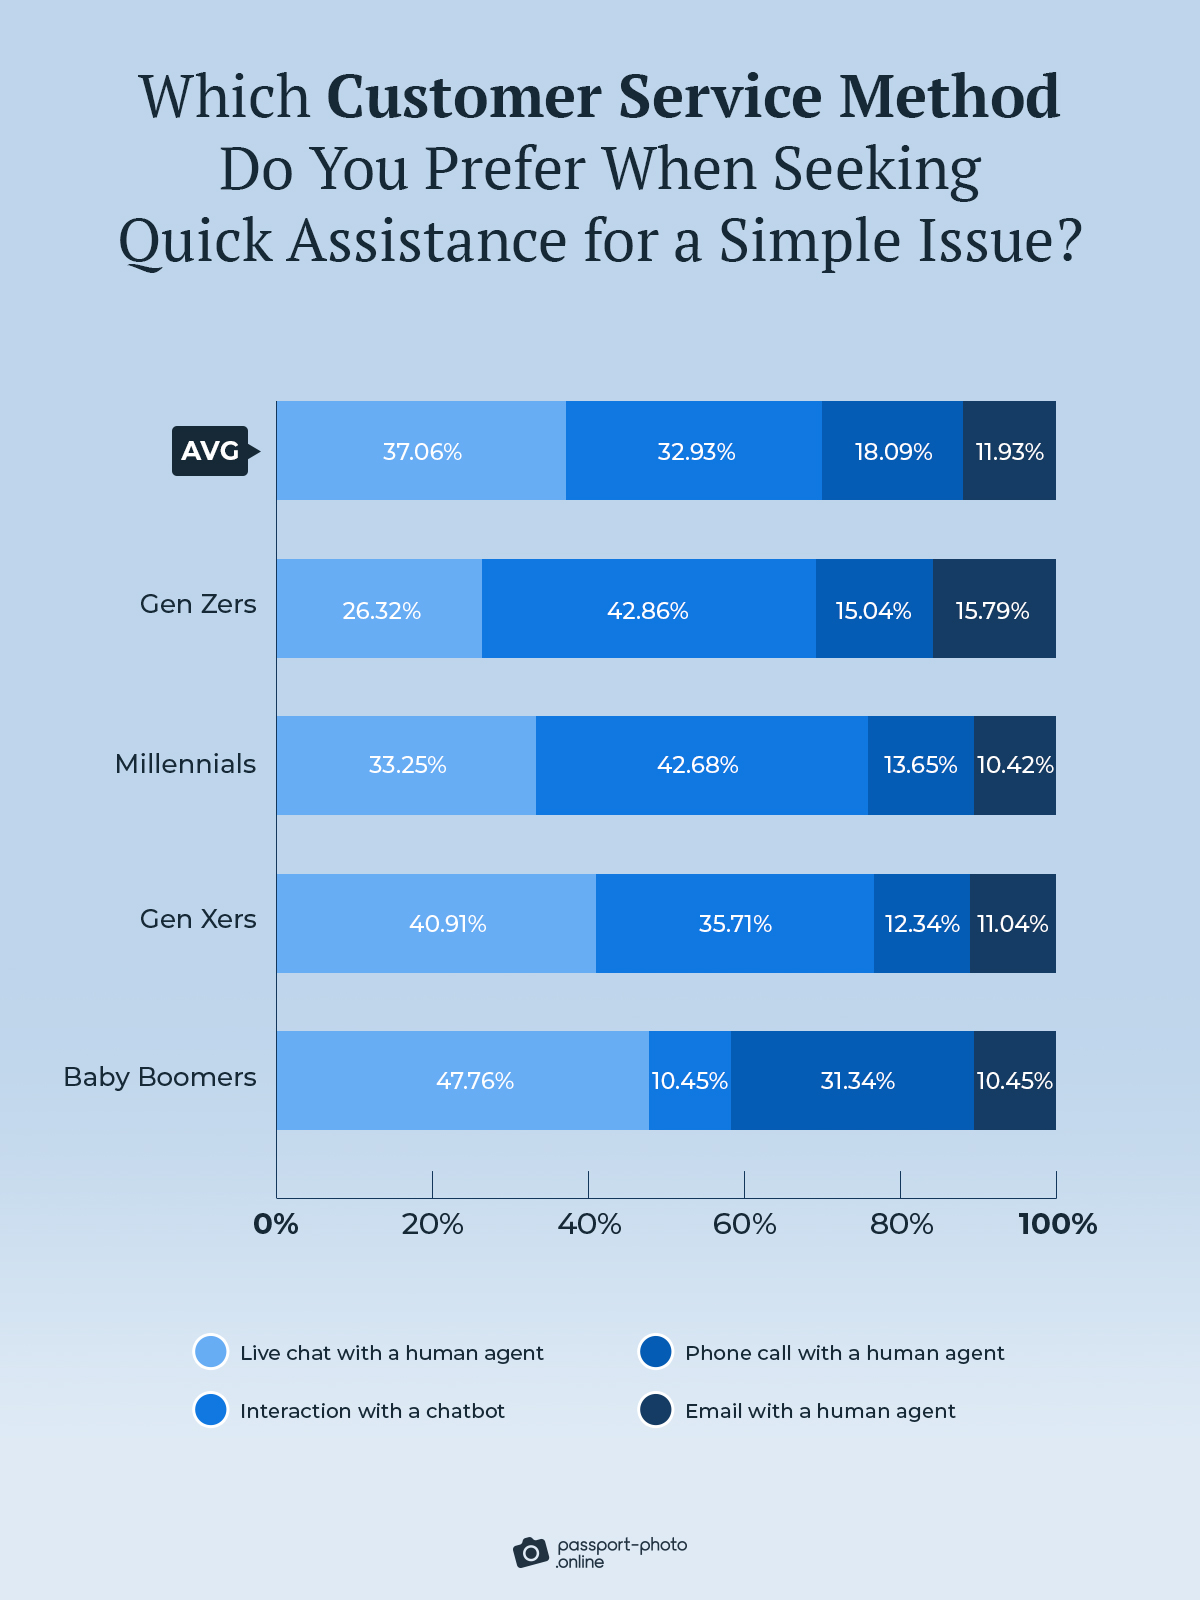
- When seeking quick assistance for a simple issue, chatbots (33%) are the second most preferred option after a live chat with a human agent (37%).
- 24/7 availability (35%) is the primary reason for using chatbots.
- Accurate and reliable answers (47%) are considered the most important feature of chatbots.
- The most commonly encountered issue when using chatbots is the failure to understand questions or requests, reported by 28% of respondents.
- Roughly 62% of internet users want chatbots to always disclose their nature during a conversation.
- Most US customers across generations are satisfied or very satisfied (68%) with their chatbot experiences.
Most Americans Have Interacted with Chatbots in Recent Years
When we said earlier that chatbots have become ubiquitous, we weren’t lying.
In fact, the global chatbot market size was valued at $5.1B in 2022, and it’s projected to grow at a CAGR of 23.3% from 2023 to 2030.
So—
When we asked our survey respondents if they’d interacted with chatbots in the last 24 months, we weren’t surprised when 93.30% said, “Yes.”
Here’s a breakdown of the responses by generation:
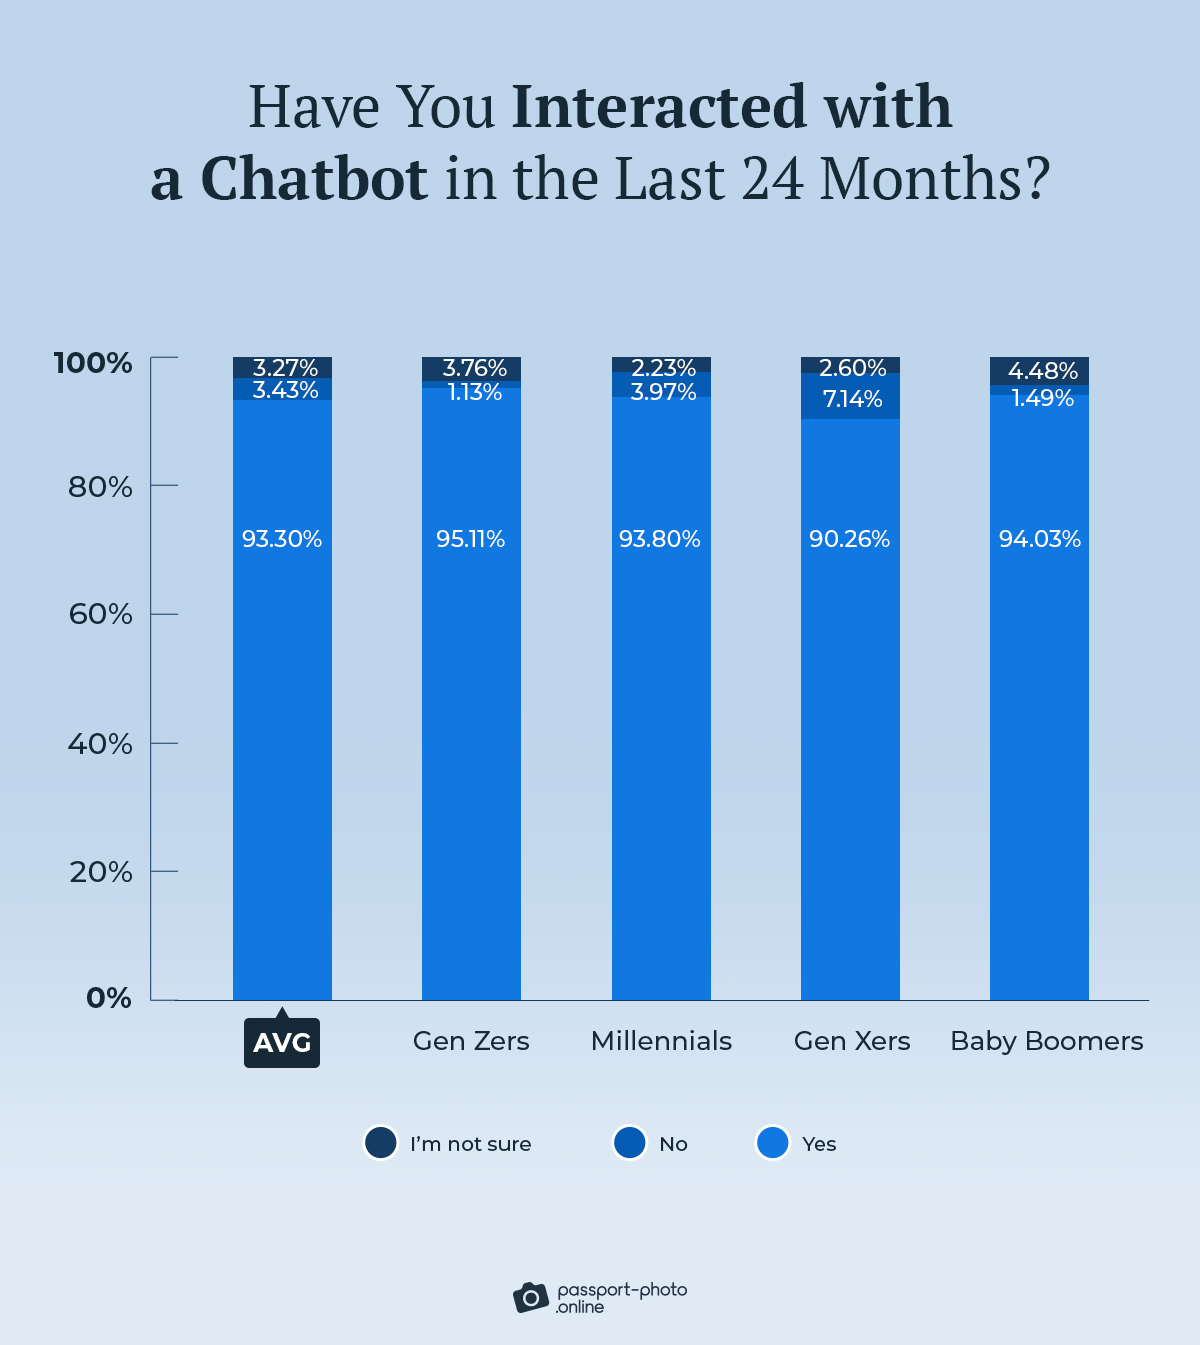
The data shows that regardless of age group, nearly all Americans have exchanged words with chatbots in one form or another.
Here’s how often they jump into a conversation with them:
| How Often Do You Interact with Chatbots? | Share |
|---|---|
| Weekly | 32.36% |
| Monthly | 31.35% |
| Daily | 22.92% |
| I’m not sure | 5.96% |
| Yearly | 5.73% |
| Never | 1.69% |
Interestingly, almost a third of the surveyed Americans indicated they use chatbots weekly or monthly.
That’s impressive.
But—
Is it actually our preferred way to seek quick help for simple issues?
Let’s look at the results:
The takeaway?
While human-based customer service methods still dominate, there’s a clear trend toward embracing chatbots among Gen Zers and Millennials, with 42.86% and 42.68% of them choosing this option, respectively.
That’s not to say that older generations are out of the loop—they just favor the old-school approach more.
Round-the-Clock Availability Emerged As the Top Reason for Engaging With Chatbots
Picture this:
You’ve got a burning question, and you need an answer ASAP.

Do you need passport photos? Find out more:
The problem?
It’s 2:00 AM, and you can’t reach customer service because of its limited hours. That’s when chatbots swoop in.
In fact, 24/7 availability was cited as the number #1 reason for conversing with chatbots at 35.28%.
Take a look:
| What’s the Primary Reason You Use Chatbots? | Share |
|---|---|
| They’re available 24/7 | 35.28% |
| They’re faster than human agents | 18.65% |
| They’re easy to use | 17.64% |
| I can use them at my own pace | 16.85% |
| I don’t want to interact with a human | 4.83% |
The other key factors are speed (18.65%) and ease of use (17.64%).
Now—
At this point, we also wanted to see if using a chatbot makes online businesses appear more trustworthy in the eyes of the public.
Let’s hear from our respondents:
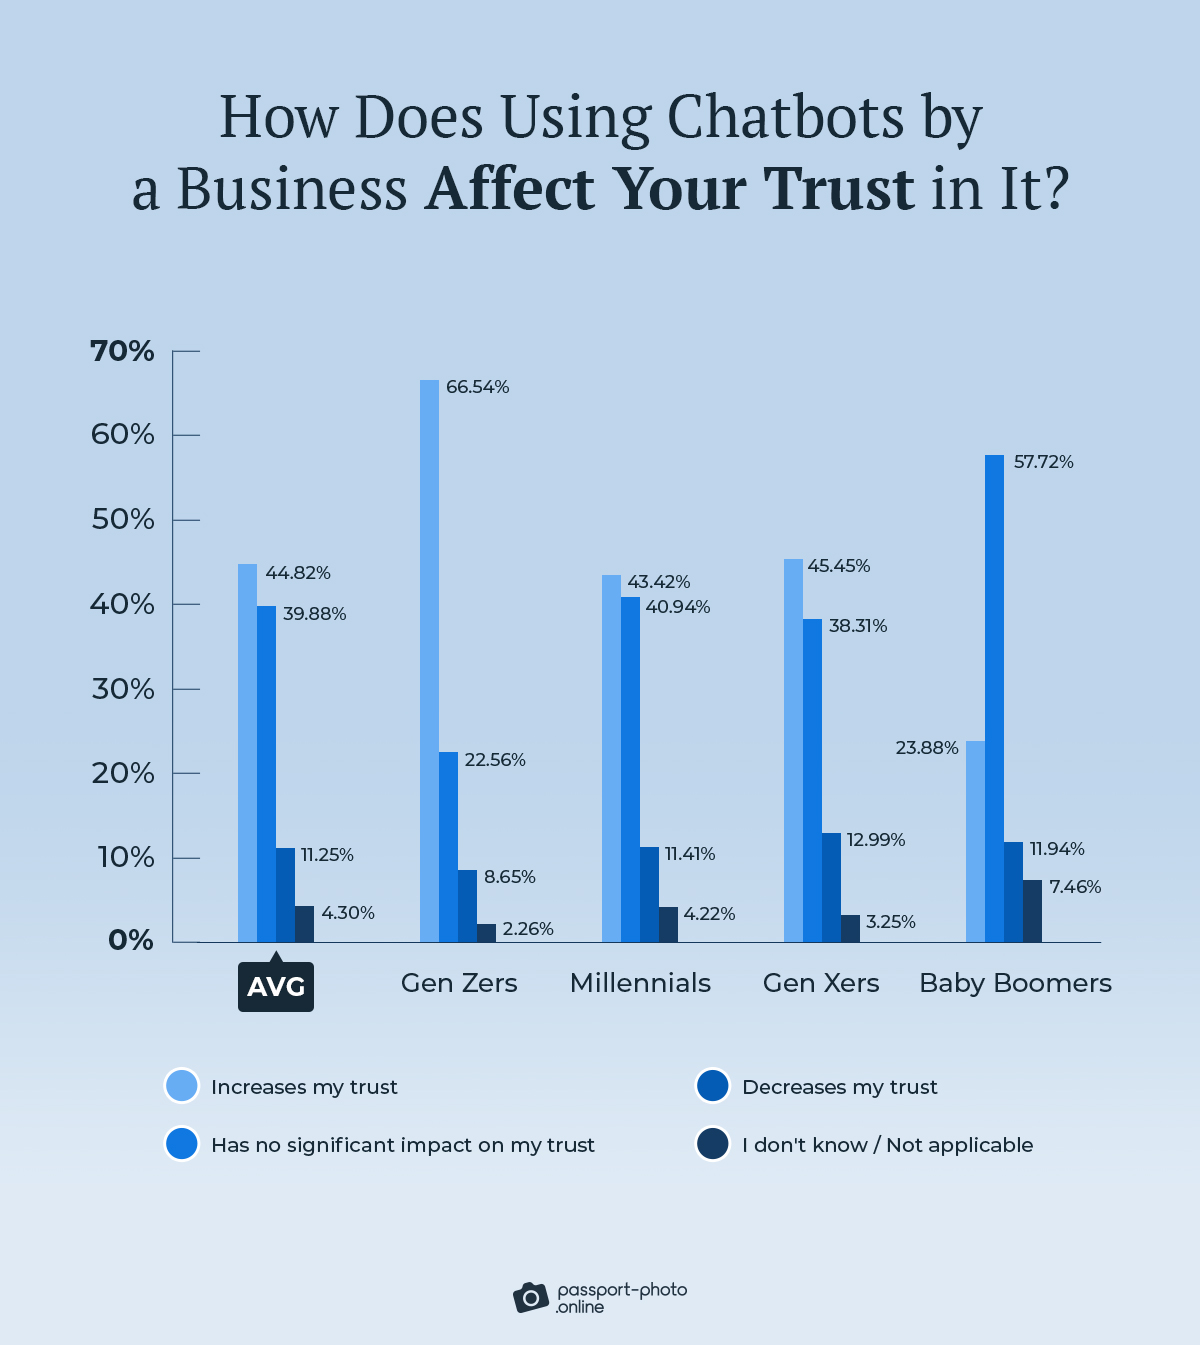
The use of chatbots seems to enhance trust in businesses, particularly among Gen Zers (66.54%).
Baby Boomers, on the other hand, aren’t swayed by chatbots as much.
So companies, take note!
Internet Users Typically Engage with Chatbots to Obtain Information
The use cases of chatbots are plentiful.
But—
Which one resonates the most with Americans?
Let’s find out:
| What Type of Tasks Do You Typically Use Chatbots For? | AVG | Men | Women |
|---|---|---|---|
| Getting information about a specific topic or subject | 27% | 30.41% | 23.58% |
| Purchasing products or services | 16.92% | 16.79% | 17.05% |
| Troubleshooting technical issues | 15.11% | 13.38% | 16.84% |
| Tracking orders or deliveries | 13.75% | 13.38% | 14.11% |
| Booking appointments or making reservations | 12.15% | 9.98% | 14.32% |
| Seeking recommendations or advice | 9.62% | 11.44% | 7.79% |
The top task for chatbots is “getting information about a specific topic or subject,” with 27% of Americans picking this option.
Interestingly, there are also subtle differences in preferences among genders.
Men use chatbots more for information gathering and seeking advice. In contrast, women lean toward practical applications like troubleshooting technical issues, tracking orders, and booking appointments.
Americans Want Chatbots to Disclose Their Nature
So far, so good.
Now that we’ve discussed chatbot usage, benefits, and functions, let’s focus on Americans’ expectations of these digital beings.
To begin with, we asked respondents how they want chatbots to introduce themselves in conversations.
The results in:
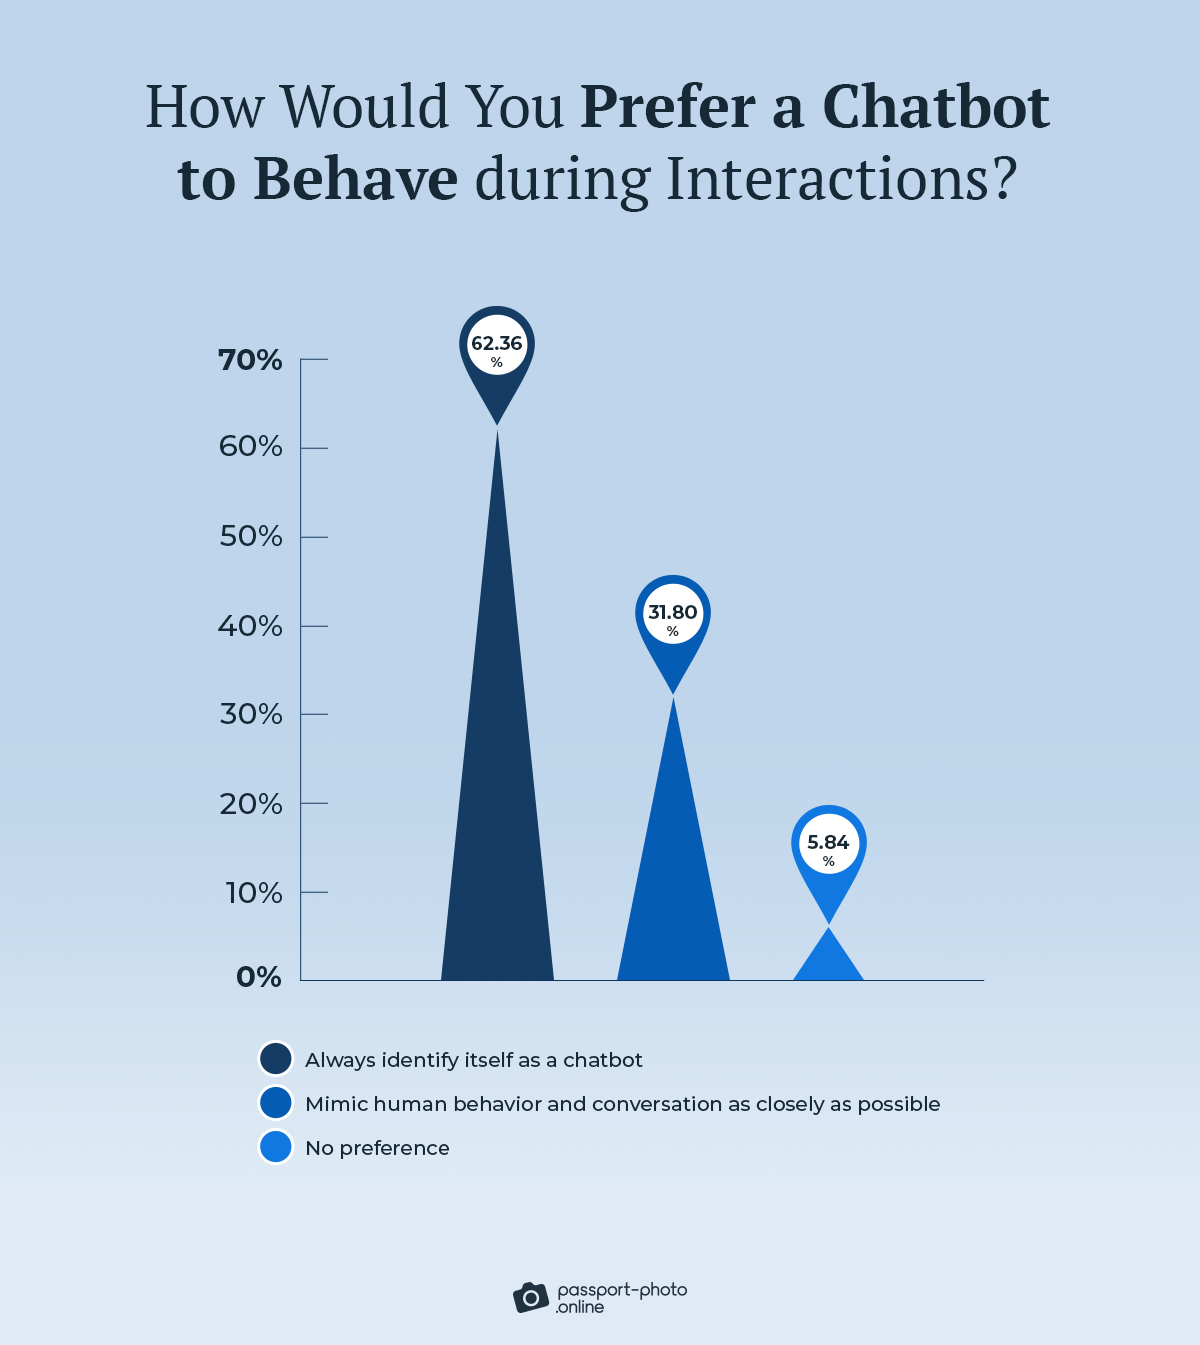
While most users appreciate that chatbots can simulate human-like conversations, they still prefer these bots to disclose their nature (62.36%).
This shows that users generally value transparency. Plus, it could indicate Americans’ understanding of chatbots’ limitations.
Moving on, we wanted to delve into the features people want to see in chatbots.
Here’s what they said:
| Which Feature Do You Consider the Most Important in a Chatbot? | Share |
|---|---|
| Accurate and reliable answers | 47.08% |
| Fast response times | 23.15% |
| Friendly/conversational tone | 16.29% |
| Personalization based on individual preferences | 12.58% |
| None of these | 0.9% |
In short, speed, friendliness, and personalization are important.
But—
It’s the provision of accurate and reliable answers (47.08%) that reigns supreme.
The Top Challenge in Chatbot Interactions Is Not Understanding Customer Queries
Like any technology, chatbots aren’t immune to the occasional hiccup.
That’s why we wanted to know which issues our survey respondents faced when conversing with these digital assistants.
Below are the results:
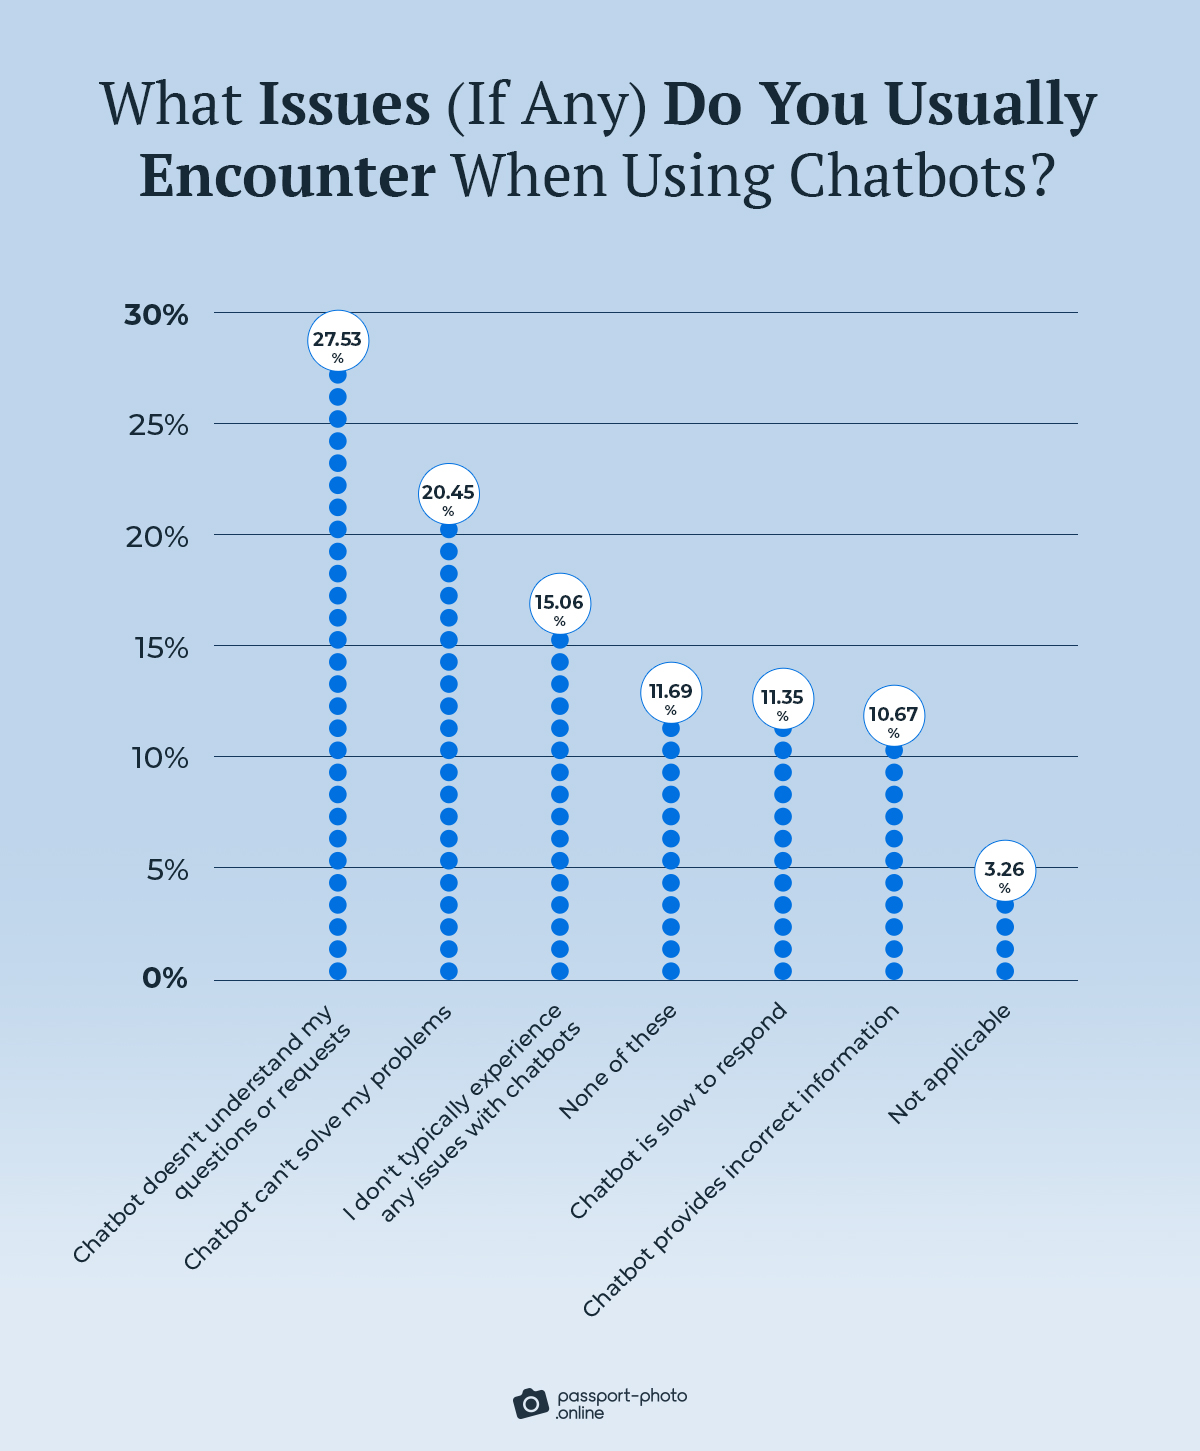
Not understanding customers’ questions or requests came out on top with 27.53% of the vote.
This shows a limitation in chatbot understanding, likely due to struggles to grasp complex or contextual inquiries.
It’s followed by subpar problem-solving abilities (20.45%) and slow response times (11.35%).
But—
All is not lost.
For our last question, we asked survey takers about their overall satisfaction with chatbots.
The results in:
| On a Scale of 1 to 5, How Satisfied Are You with Your Overall Experiences with Chatbots? | AVG | Gen Zers | Millennials | Gen Xers | Baby Boomers |
|---|---|---|---|---|---|
| Satisfied | 45.92% | 60.15% | 50.12% | 33.12% | 40.3% |
| Very satisfied | 22.38% | 23.68% | 20.6% | 31.82% | 13.43% |
| Neutral / No opinion | 21.56% | 14.29% | 22.08% | 25.97% | 23.88% |
| Unsatisfied | 7.97% | 1.88% | 4.96% | 7.14% | 17.91% |
| Very unsatisfied | 2% | 0% | 2.23% | 1.95% | 4.48% |
That data shows that most Americans across generations are satisfied with their chatbot experiences, with Gen Zers leading the pack (83.83%).
Yet—
Baby Boomers aren’t quite as thrilled, exhibiting the highest dissatisfaction rates (22.39%).
This might suggest the need for improved user experience or clearer guidance for this demographic.
Stacking It All Up
There you have it.
A comprehensive look at US customers’ experiences with chatbots.
Now—
What’s your opinion on automated chat agents? Do you prefer them to humans?
Let us know in the comments below.
Methodology
We conducted an online survey of 1,027 US respondents via a bespoke online polling tool in June 2023.
The respondents were 46.2% male, 53.4% female, and 0.4% identified as other. 29.9% of respondents were 26 or younger, 45.3% were aged 27–42, 17.3% were aged 43–58, and 7.5% were 59 or older.
This survey has a confidence level of 95% and a margin of error of 3%. Given the gender and age makeup of our sample size, the study’s findings are statistically significant for the population at large.
This study was created through multiple research steps, crowdsourcing, and surveying. Data scientists reviewed all survey participants’ responses for quality control. The survey also had an attention-check question.
Fair Use Statement
Did our findings help you learn more about chatbots? If you believe your audience will be interested in this information, feel free to share it. Just remember to mention the source and link back to this page.
Sources
- Botco.ai, “The State of Chatbots in Marketing 2022”
- Precedence Research, “Chatbot Market Size To Hold USD 4.9 Billion By 2032”
- Tidio, “23 Top Real-Life Chatbot Use Cases That Work”

As a Digital PR specialist and a member of the Society of Professional Journalists (SPJ), Max has 5+ years of writing experience.
Over the course of his career, Max’s work has garnered significant attention, with features in numerous prominent publications such as The New York Times, Forbes, Inc., Business Insider, Fast Company, Entrepreneur, BBC, TechRepublic, Glassdoor, and G2.
