


Intrigued about mobile app usage in 2026?
We’ve got you covered.
We’ve compiled a definitive list of the latest statistics, trends, and facts below.
Jump to your preferred category or scroll down for the TOP app usage statistics.
Top App Usage Statistics (Editor’s Picks)
- About 6.92B people use smartphones, representing 86.11% of the population. This number is projected to reach 7.33B by 2025.
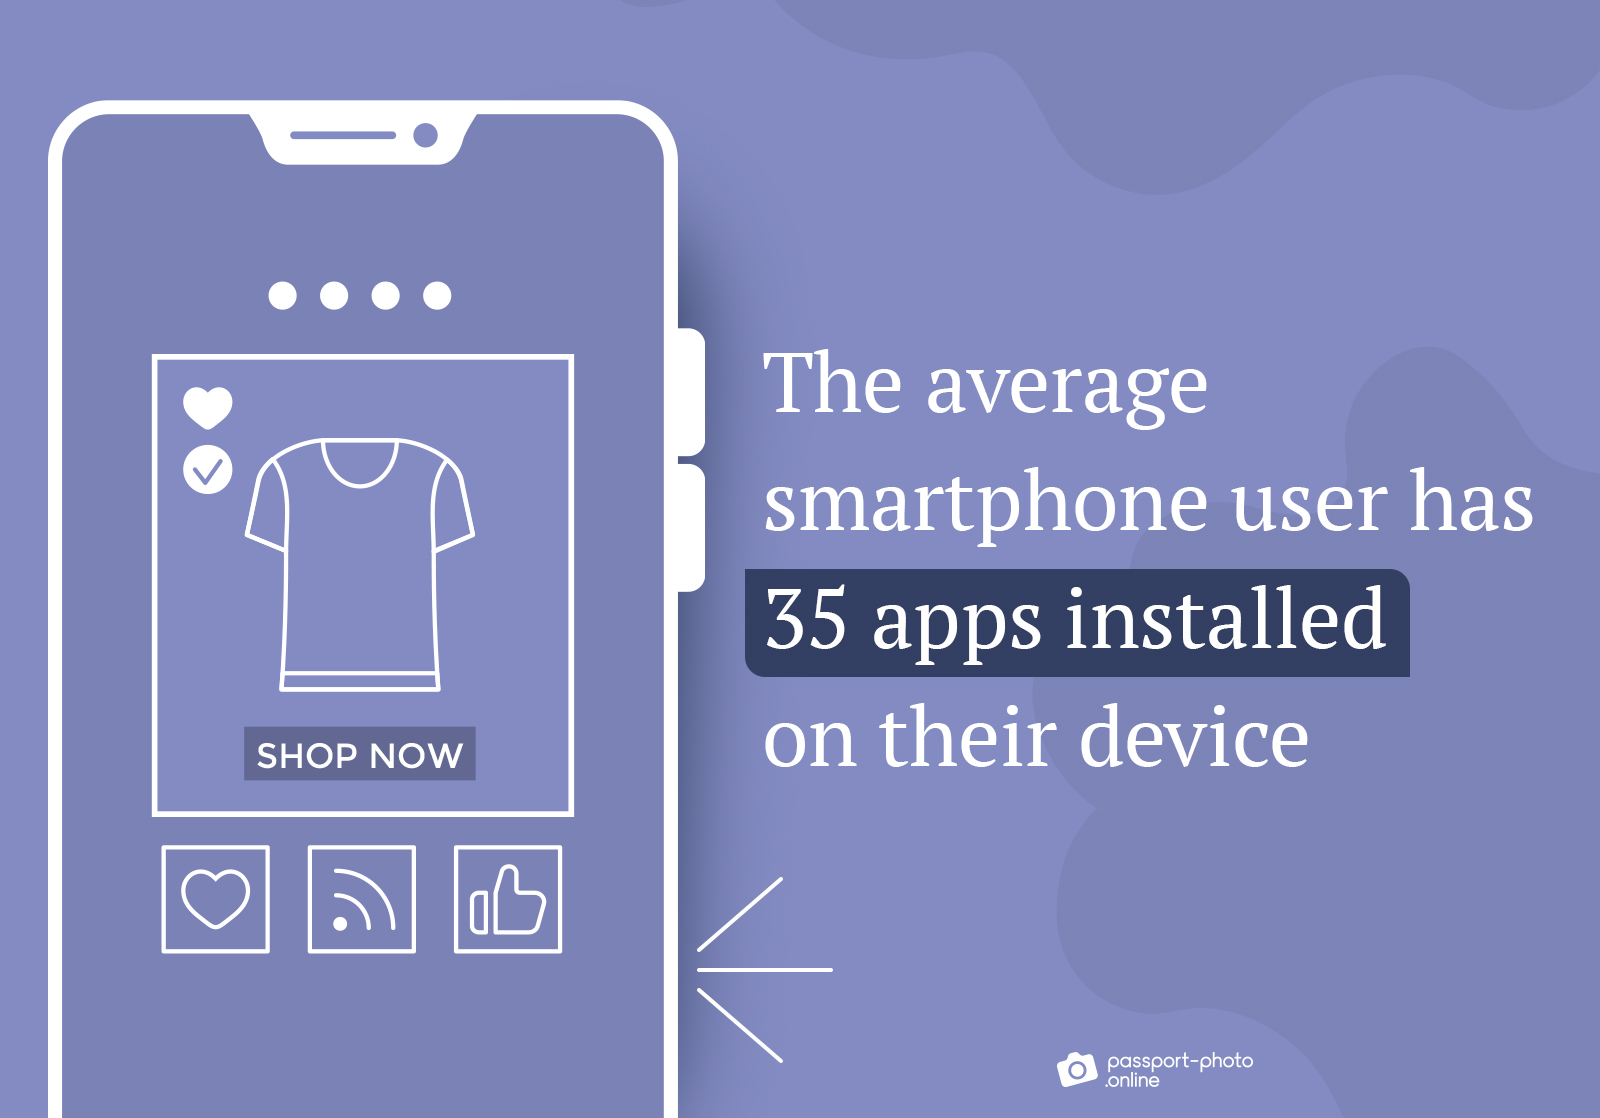
- The average smartphone user has 35 apps installed on their device.
- The average smartphone owner engages with nine apps daily and ~30 monthly.
- A full 84% of smartphone owners use apps in their morning routine.
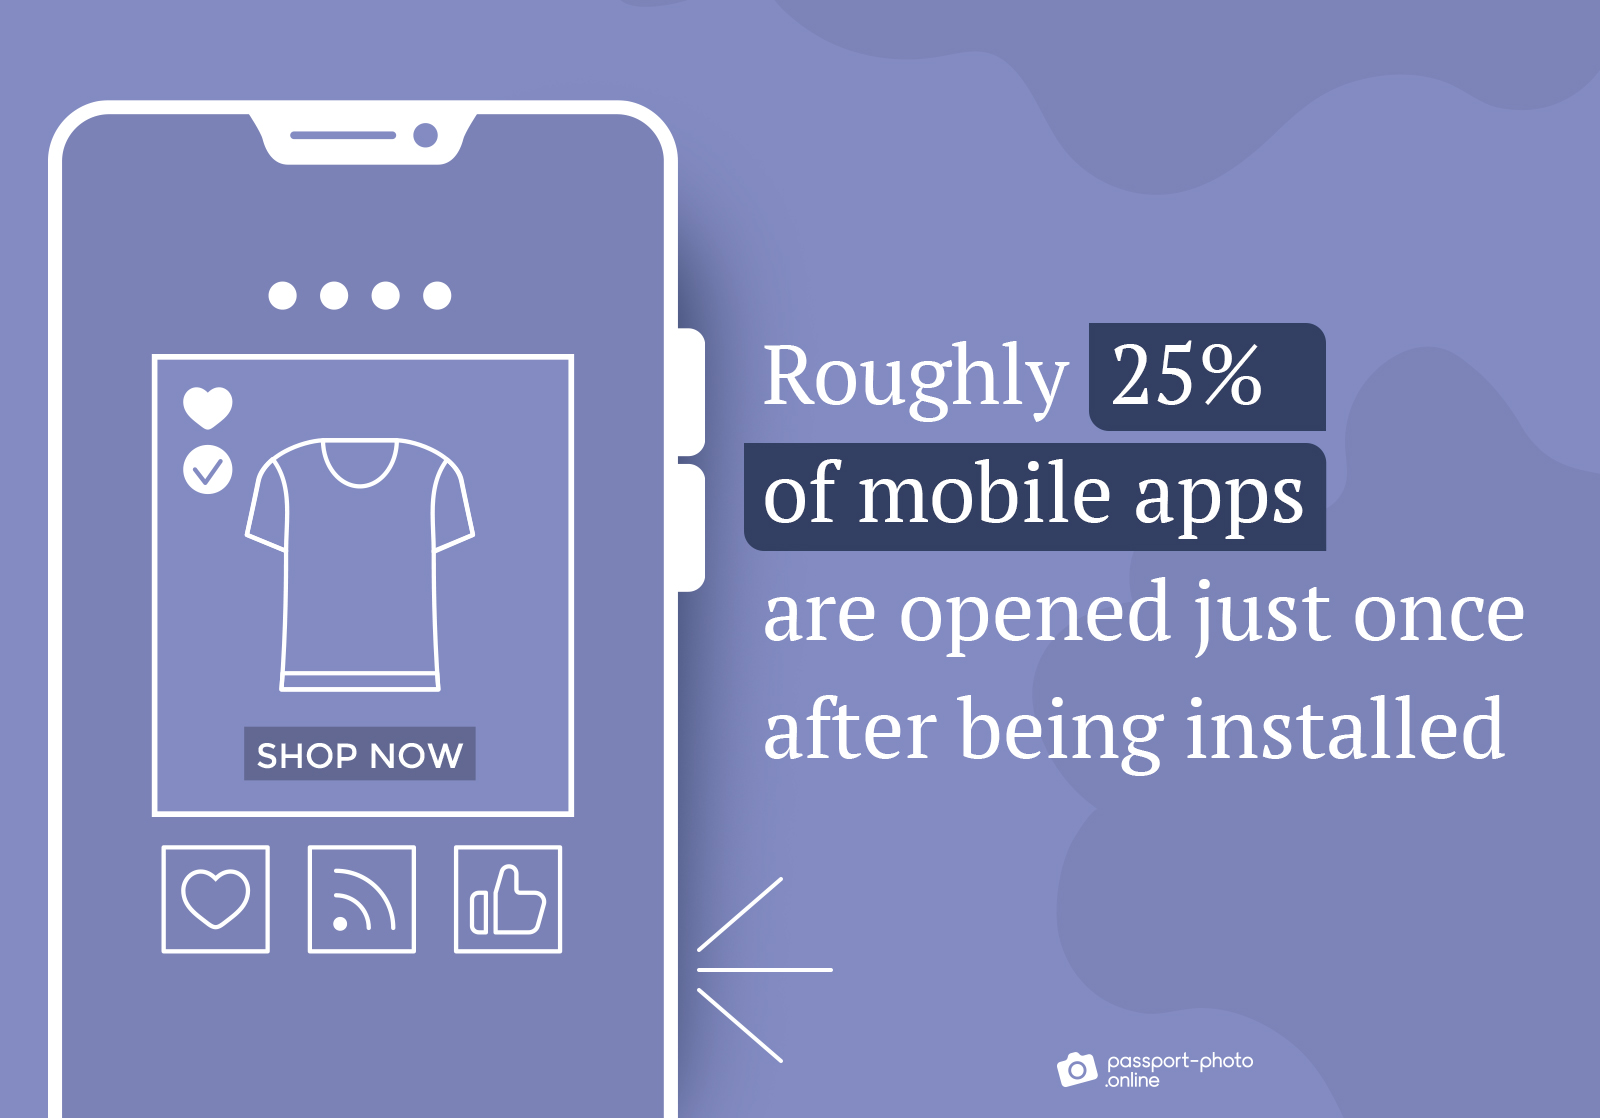
- Roughly 25% of mobile apps are opened just once after being installed.
- As of July 2023, there are ~2.65M apps in Google Play.
- As of Q3 2022, the Apple App Store has 1.64M apps.
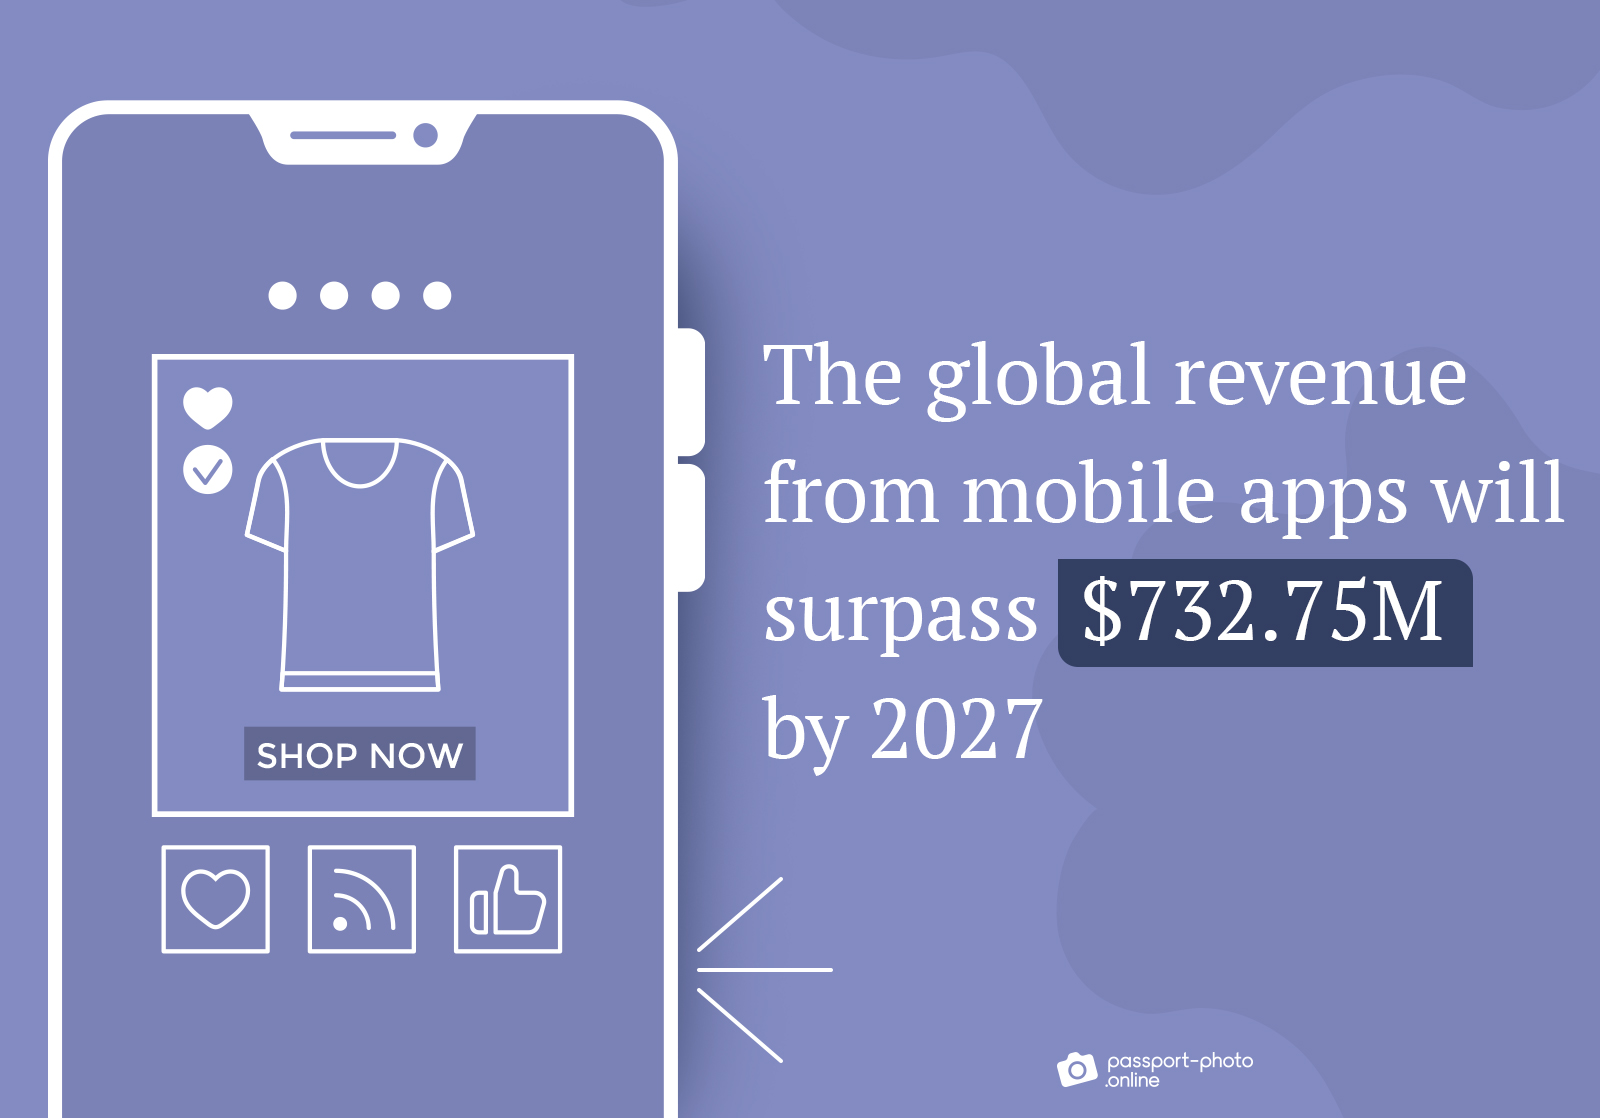
- By 2027, global revenue from mobile apps will surpass $732.75M, an increase from $542.39M in 2023.
- The global annual app downloads are expected to reach 299B in 2023, an increase from ~247B downloads in 2020.
Global Mobile App Market: Overview and Growth Projections
- In 2022, the global mobile application market reached $206.85B.
- The mobile app market is set to grow at a CAGR of 13.8% between 2023 and 2030.
- By 2027, global revenue from mobile apps will surpass $732.75M, an increase from $542.39M in 2023.
- The revenue of global mobile gaming apps rose from $86.9B in 2020 to ~$92.2B in 2022.
- In 2022, Asia Pacific dominated the mobile app market, capturing over 32% of the revenue share.
- The Apple Store segment spearheaded the mobile app market in 2022, which accounted for more than 62% of the global revenue share.
- In 2022, the gaming application segment commanded the largest revenue share of over 42% in the mobile application market.
- The mobile app development market was valued at $82.32B in 2022 and is expected to reach $366.93B by 2030, with a CAGR of 23.80%.
- In 2023, the in-app advertising market reached $94.44B and is expected to hit $338.9B by 2032, with a CAGR of 17.32%.
- As of March 2023, most apps in Google Play (97%) and the App Store (94.5%) are free.
- In March 2023, 8% of apps from the US and 3% of global apps were monetized through paid downloads.
| Top App Monetization Methods by US Publishers (as of March 2023) | US Apps | Overall Apps |
|---|---|---|
| Paid apps | 8% | 3% |
| Include ads | 26% | 36% |
| In-app billing | 11% | 4% |
Mobile App Usage: User Behavior
- The average smartphone owner engages with nine apps daily and ~30 monthly.
- Roughly 25% of mobile apps are opened just once after being installed.
- A full 84% of smartphone owners use apps in their morning routine.
- In 2022, daily mobile app usage among US users increased to 4 hours and 21 minutes, compared to 3 hours and 16 minutes in 2019.
| Mobile App Usage in Select Countries: 2019 vs. 2022 | 2019 | 2022 |
|---|---|---|
| Indonesia | 3.54 | 5.39 |
| Brazil | 4.04 | 5.19 |
| Saudi Arabia | 3.09 | 5.18 |
| Singapore | 3.16 | 5.18 |
| Worldwide | 3.43 | 5.01 |
| South Korea | 4.04 | 4.59 |
| Mexico | 3.52 | 4.56 |
| Australia | 2.55 | 4.54 |
| India | 3.44 | 4.51 |
| Japan | 3.41 | 4.48 |
| Thailand | 3.21 | 4.40 |
| Canada | 3.11 | 4.38 |
| United States | 3.16 | 4.21 |
| Turkey | 3.11 | 4.18 |
| United Kingdom | 2.58 | 4.14 |
| France | 2.41 | 3.52 |
| Argentina | 3.13 | 3.51 |
| Germany | 2.36 | 3.36 |
| China | 3.11 | 3.33 |
- From October 2020 to March 2021, users worldwide spent around 55.48 minutes daily on social media apps.
| Daily App Usage by Category, Global Users (2020–2021) | In Minutes |
|---|---|
| Social | 55.48 |
| Games | 16.70 |
| Entertainment | 13.53 |
| Sports | 13.21 |
| Shopping | 13.01 |
| Travel | 10.25 |
| Finance | 6.30 |
- Social and communication apps comprised about 42% of users’ time on mobile apps globally in 2022.
| Global App User Engagement by Category (2022) | Share |
|---|---|
| Social and Communication | 42.40% |
| Photo and Video | 25.10% |
| Games | 8% |
| Entertainment | 3.10% |
| Shopping | 2.70% |
| Others | 18.70% |
- Around 39% of people uninstall apps when they stop using them.
| Main Causes for App Uninstalls | Share |
|---|---|
| Not in use | 39.9% |
| Limited storage | 18.7% |
| Excessive advertising | 16.2% |
| Too many notifications | 12.6% |
| Confusion | 5.4% |
| Technical issues | 5.4% |
| Other | 1.6% |
The Landscape of Global App Downloads
- Global mobile app downloads hit 255B in 2022.
| Global Mobile App Downloads (2016–2022) | In Billions |
|---|---|
| 2016 | 140.68 |
| 2018 | 192.45 |
| 2019 | 204 |
| 2020 | 218 |
| 2021 | 230 |
| 2022 | 255 |
- Instagram was the world’s leading social media app in 2022, with 547M downloads.
| Top Social Media Apps by Global Downloads (2022) | In Millions |
|---|---|
| 547 | |
| 424 | |
| Telegram | 310 |
| 298 | |
| Messenger | 210 |
| 159 | |
| Facebook Lite | 151 |
| Discord | 105 |
| 96 | |
| BeReal | 91 |
- In 2022, the download rate for mobile apps surpassed 485,000 per minute.
- Pakistan had the highest YOY growth in mobile app downloads globally in 2022, with its users downloading ~35% more apps compared to 2021.
| Leading Markets with Highest YOY Mobile App Download Growth (2022) | Share |
|---|---|
| Pakistan | 35% |
| China | 13% |
| Worldwide | 11% |
| India | 8% |
| Philippines | 8% |
| Mexico | 6% |
| Indonesia | 5% |
| Turkey | 5% |
| Colombia | 5% |
| Vietnam | 4% |
| Brazil | 3% |
| France | 3% |
| Germany | 1% |
| United States | 0% |
- By 2026, consumers are expected to download 143B mobile apps from Google Play and 38B from the App Store.
| Worldwide Mobile App Downloads by Store: 2021–2026 (in Billions) | App Store | Google Play |
|---|---|---|
| 2021 | 33 | 111 |
| 2022 | 34 | 114 |
| 2023 | 35 | 121 |
| 2024 | 36 | 129 |
| 2025 | 37 | 136 |
| 2026 | 38 | 143 |
- By 2027, the number of downloads for mobile apps in the Photo and Video segment is expected to reach 36.9M.
| Global Mobile App Downloads by Segment: 2021–2027 (in Millions) | Photo and Video | Travel | Business | Social Networking | Games |
|---|---|---|---|---|---|
| 2021 | 23,368.64 | 1,883.31 | 2,980.63 | 10,288.52 | 116,044.09 |
| 2022 | 26,397.75 | 2,308.20 | 3,634.05 | 11,190.77 | 118,700.64 |
| 2023 | 29,074.62 | 2,663.36 | 4,183.13 | 12,039.42 | 134,938.67 |
| 2024 | 31,471.63 | 2,970.55 | 4,656.18 | 12,825.27 | 150,366.05 |
| 2025 | 33,641.07 | 3,241.96 | 5,070.38 | 13,551.32 | 160,539.72 |
| 2026 | 35,448.93 | 3,468.13 | 5,415.54 | 14,156.35 | 169,010.76 |
| 2027 | 36,955.49 | 3,656.61 | 5,703.18 | 14,660.55 | 176,071.67 |
Consumer Expenditure on Mobile Apps
- Consumer spending on mobile apps totaled $167B in 2022, slightly lower than the $170B recorded in 2021.
| Global Consumer Expenditure on Mobile Apps (2016–2022) | In Billion US Dollars |
|---|---|
| 2016 | 57.70 |
| 2017 | 82.10 |
| 2018 | 101 |
| 2019 | 120 |
| 2020 | 143 |
| 2021 | 170 |
| 2022 | 167 |
- Global consumer spending on mobile apps reached $33.7B in Q1 2023, a 2% increase compared to the same quarter in 2022.
| Quarterly Consumer Expenditure on Mobile Apps (2019–2023) | In Billion US Dollars |
|---|---|
| Q1 ’19 | 22 |
| Q2 ’19 | 22.60 |
| Q3 ’19 | 23 |
| Q1 ’20 | 23.40 |
| Q2 ’20 | 27 |
| Q3 ’20 | 28 |
| Q4 ’20 | 64.60 |
| Q1 ’21 | 32 |
| Q2 ’21 | 34 |
| Q3 ’21 | 34 |
| Q4 ’21 | 70 |
| Q1’22 | 33 |
| Q2 ’22 | 33 |
| Q3 ’22 | 32.40 |
| Q4 ’22 | 68.70 |
| Q1 ’23 | 33.70 |
- Globally, the average consumer expenditure on mobile apps per smartphone in Q1 2023 was around $4.88, a decline from the $5.03 in Q1 2022.
| Quarterly Mobile App Expenditure per User (2019–2022) | In US Dollars |
|---|---|
| Q1 ’19 | 4.17 |
| Q2 ’19 | 4.04 |
| Q3 ’19 | 4.11 |
| Q1 ’20 | 3.90 |
| Q2 ’20 | 4.48 |
| Q3 ’20 | 4.64 |
| Q1 ’21 | 5.29 |
| Q2 ’21 | 5.31 |
| Q3 ’21 | 5.31 |
| Q1 ’22 | 5.03 |
| Q2 ’22 | 4.95 |
| Q3 ’22 | 4.86 |
| Q1 ’23 | 4.88 |
- App Store consumer spending is projected to grow from $85B to over $161B by 2026, with a CAGR of +13.7%.
| Global Spending on Apps and Games in the App Store: 2021–2026 (in Billion US Dollars) | Games | Apps |
|---|---|---|
| 2021 | 52 | 33 |
| 2022 | 53 | 39 |
| 2023 | 57 | 51 |
| 2024 | 62 | 63 |
| 2025 | 66 | 77 |
| 2026 | 70 | 91 |
- Consumer spending on social apps in North America is projected to reach $6.1B by 2025.
| Consumer Spending on Mobile Social Apps by Region: 2019–2025 (in Million US Dollars) | North America | Europe |
|---|---|---|
| 2019 | 937.90 | 549.80 |
| 2020 | 1,455 | 650.60 |
| 2021 | 2,193.60 | 794.20 |
| 2022 | 2,917.50 | 1,032.50 |
| 2025 | 6,115.10 | 2,015.40 |

Do you need passport photos? Find out more:
Apple App Store: Downloads, Revenues, and Developer Trends
- As of Q3 2022, the Apple App Store has 1.64M apps making it the second-largest store.
- The App Store segment spearheaded the mobile app market in 2022, which accounted for more than 62% of the global revenue share.
- In Q3 2022, gaming apps were the most popular category in the App Store, accounting for 12.68% of all apps on the platform.
| Top App Store Categories (as of Q3 2022) | App Share |
|---|---|
| Games | 12.68% |
| Business | 10.35% |
| Education | 9.79% |
| Utilities | 9.22% |
| Lifestyle | 7.93% |
| Food and Drink | 6.58% |
| Shopping | 5.26% |
| Health and Fitness | 5.08% |
| Productivity | 4.84% |
| Finance | 4.16% |
- The number of initial app installs from the App Store is projected to grow from 33B in 2021 to ~38B in 2026.
- In September 2022, Tinder was the top-grossing app in the App Store worldwide, amassing ~$37.6M in revenue.
| Top Three Revenue-Generating iOS Apps Worldwide (2022) | In Million US Dollars |
|---|---|
| Tinder | 37.58 |
| TikTok | 35.14 |
| Honor of Kings | 24.05 |
- In September 2022, BeReal became the most downloaded iPhone app in the App Store.
| Top iPhone Apps by Global Downloads (2022) | In Millions |
|---|---|
| BeReal | 13.89 |
| TikTok | 7.51 |
| X-HERO | 7.18 |
| WhatsApp Messenger | 6.96 |
| Survivor!.io | 4.64 |
- As of May 2023, iOS gaming apps in the App Store have an average price of $0.49, while the average price of all apps is ~$0.90. The average price of apps and games combined stands at $0.80.
- In Q3 2022, the retention rate of iOS apps after one day stood at 25.6%, while the retention rate after 30 days was 43%.
- In 2022, the App Store witnessed a surge in new developers and entrepreneurs from Europe (25%), China (23%), the US (14%), Japan (4%), and 35% from other regions like South Korea, India, and Brazil.
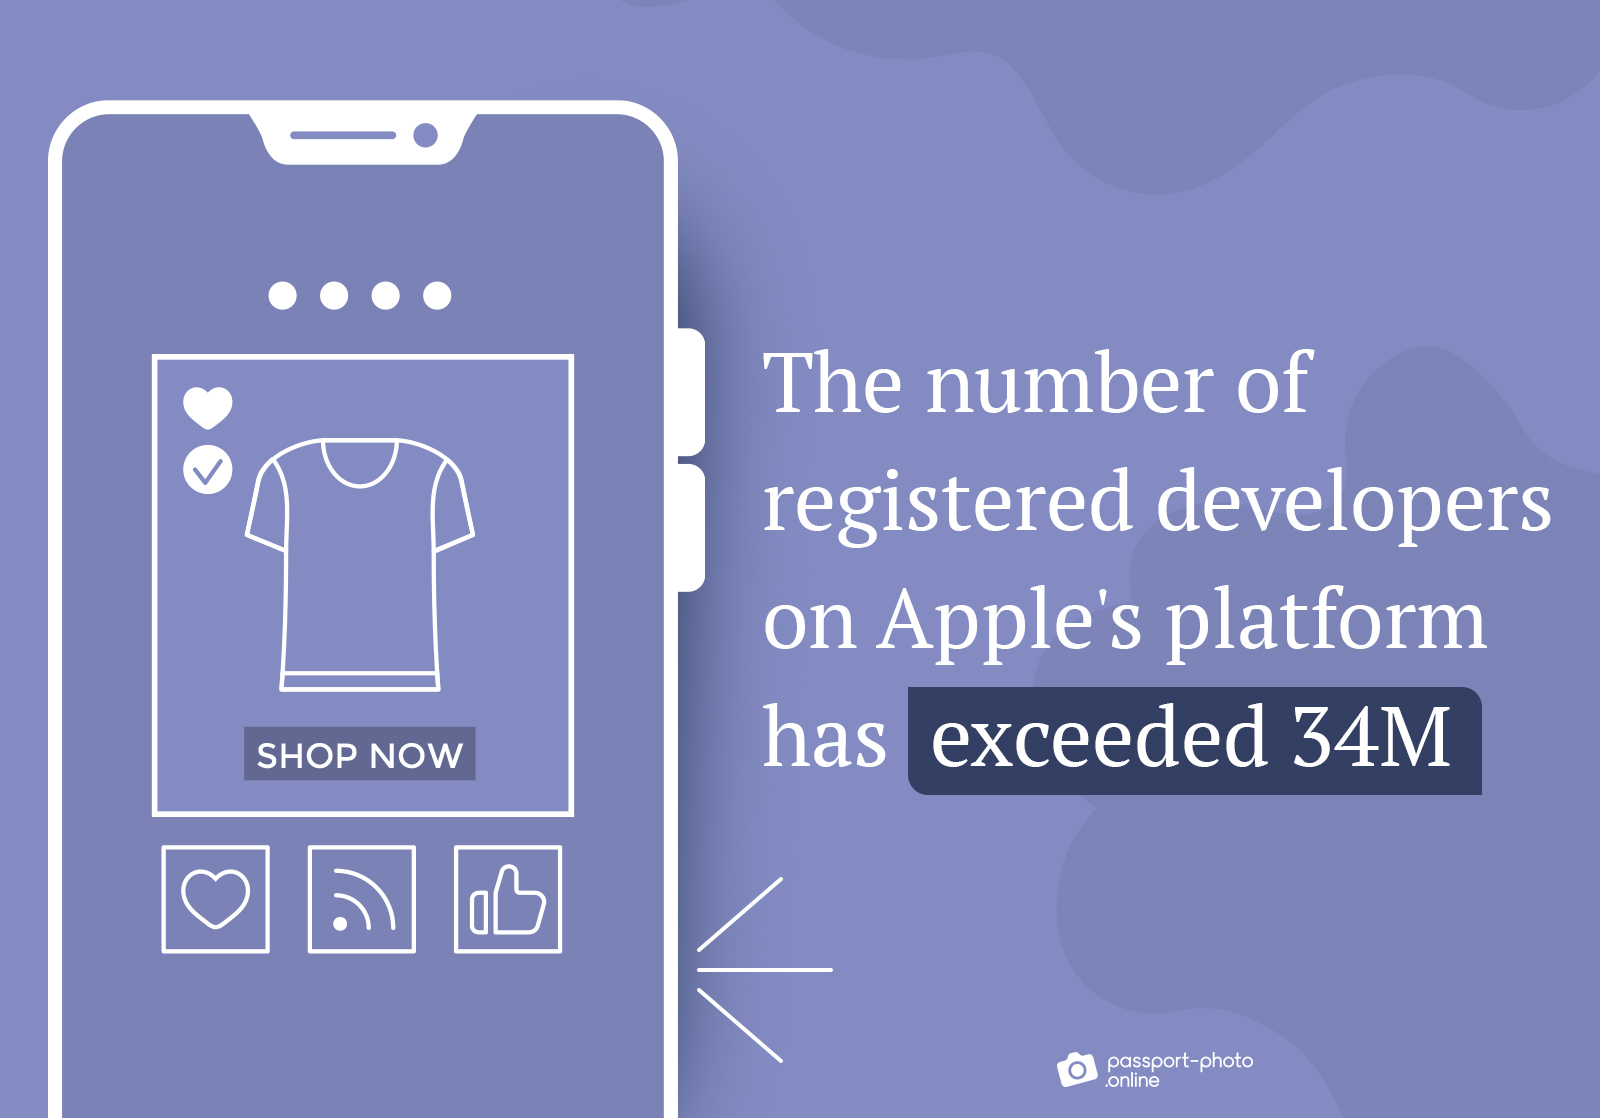
- The number of registered developers on Apple’s platform has exceeded 34M.
- Small developers (=those earning up to $1M a year and with fewer than 1M annual downloads) make up 90% of all developers on the App Store.
- Roughly 80% of small developers in 2022 operated on multiple storefronts.
- Among developers earning over $1M in 2022 on the App Store, 40% were either absent from the platform or had earnings below $10,000 just five years ago.
- By January 2023, iOS app developers had received a cumulative payment of over $320B from Apple.
| Cumulative iOS Developer Payout (2014–2023) | In Billion US Dollars |
|---|---|
| Jan ’14 | 15 |
| Jul ’14 | 20 |
| Jan ’15 | 25 |
| Aug ’15 | 33 |
| Jan ’16 | 40 |
| Jun ’16 | 50 |
| Jan ’17 | 60 |
| Jun ’17 | 70 |
| Jan ’18 | 86 |
| Jun ’18 | 100 |
| Jan ’19 | 120 |
| Jan ’20 | 155 |
| Jan ’21 | 200 |
| Jan ’22 | 260 |
| Jan ’23 | 320 |
- Revenue for small developers on the App Store increased by 71% from 2020 to 2022.
Google Play Store: Downloads, Revenues, and Trends
- As of July 2023, there are ~2.65M apps on the Google Play Store, making it the largest store.
- Free apps make up about 96.3% of the total on Google Play, while paid apps constitute 3.7%.
- Games are the most popular app category in the Google Play Store, comprising 13.8% of all apps worldwide as of Q3 2022.
| Leading Google Play App Categories (as of Q3 2022) | Share of Apps |
|---|---|
| Games | 13.80% |
| Education | 10.47% |
| Business | 7.11% |
| Tools | 6.46% |
| Entertainment | 5.50% |
| Music and Audio | 5.04% |
| Food and Drink | 4.83% |
| Shopping | 4.74% |
| Lifestyle | 4.53% |
| Productivity | 4.16% |
- TikTok became the most downloaded app globally in Google Play in September 2022, with nearly 24M downloads.
| Most Downloaded Android Apps Worldwide (2022) | In Millions |
|---|---|
| TikTok | 23.96 |
| 21.17 | |
| WhatsApp Messenger | 20.72 |
| Stumble Guys | 17.51 |
| Snapchat | 15.27 |
- As of March 2023, Google Play has ~38,500 apps priced under $1, followed by over 26,600 apps in the $1–2 range.
| Price Distribution of Apps in the Google Play Store (as of March 2023) | Number Apps |
|---|---|
| Less than $1 | 38,512 |
| $1–2 | 26,695 |
| $2–3 | 13,416 |
| $3–4 | 8,091 |
| $4–5 | 6,767 |
| $5–6 | 3,637 |
| $6–7 | 2,520 |
| $7–8 | 2,164 |
| $8–9 | 1,286 |
| $9–10 | 2,303 |
- Coin Master amassed around $48M in global revenue via the Google Play Store in September 2022.
| Top Android Apps by Revenue Worldwide in 2022 | In Million US Dollars |
|---|---|
| Coin Master | 47.96 |
| TikTok | 40.66 |
| Candy Crush Saga | 38.67 |
- The number of initial app installations on Google will go from 111B to 143B by 2026.
- The consumer expenditure on Google is projected to increase from $47B to $75B by 2026.
- In Q3 2022, the 30-day retention rate for Android apps stood at around 2.6%. After one day, the retention rate was 22.6%, and after seven days, it decreased to 6.5%.
Stacking It All Up
There you have it.
A comprehensive list of mobile app usage statistics, facts, and trends.
Let us know in the comments if there are any other stats you’d like to see.
FAQ
What’s the size of the global mobile application market?
What’s the revenue of mobile applications?
How many apps are there on the App Store?
How many apps are there in the Google Play Store?
How many apps are there in the world?
How many apps does the average person have?
Fair Use Statement
Did you like our infographics? If so, feel free to share them with your audience. Just remember to mention the source and link back to this page.
Sources
- 42matters, “Google Play vs iOS App Store | Store Stats for Mobile Apps”
- AppBrain, “Number of Android Apps on Google Play”
- Apple, “Apple Celebrates a Groundbreaking Year in Entertainment”
- Apple, “Small Developers on the App Store Grew Revenue by 71 Percent from 2020–2022”
- AppleInsider, “Apple Now Has over 34 Million Registered Developers”
- Business 2 Community, “25% of Users Abandon Apps After One Use”
- Cisco, “Annual Internet Report (2018–2023) White Paper”
- CleverTap, “Why Users Uninstall Apps: 28% of People Feel Spammed [Survey]”
- Data.ai, “5 Mobile App Forecasts for 2023”
- Data.ai, “Evolution of Social Media Apps Report”
- Data.ai, “State of Mobile 2023”
- Digital Information World, “Global App Spend Predicted to Increase 77% to $233 Billion By 2026”
- Grand View Research, “Mobile Application Market Size, Share & Trends Report, 2030”
- Insider Intelligence, “The Majority of Americans’ Mobile Time Spent Takes Place in Apps”
- Market Research Future, “In-app Advertising Market Size, Growth & Outlook – 2032”
- Market Research Future, “Mobile App Development Market Size, Share, Growth and Forecast 2030”
- Passport Photo Online, “Smartphone Usage Statistics, Facts, and Trends”
- PGbiz, “App Store Metrics”
- Statista, “Chart: 84% of Smartphone Owners Use Apps During Their Morning Routine”
- Statista, “Mobile App Usage – Statistics & Facts”
- Statista, “Most Popular App Monetization Methods by Publishers from the United States as of March 2023”
- Statista, “Most Popular Apple App Store Categories as of 3rd Quarter 2022, by Share of Available Apps”
- Statista, “Number of Apps Available in Leading App Stores as of 3rd Quarter 2022”
- Statista, “Revenue of Mobile Apps Worldwide 2019–2027, by Segment”
- TechCrunch, “App Downloads Were Stagnant in the Fourth Quarter, New Analysis Finds”
- TechCrunch, “Report: Smartphone Owners Are Using 9 Apps per Day, 30 per Month”
- Think with Google, “Average Number of Apps on Smartphones”
- VentureBeat, “Data.ai: Mobile Game App Revenue Split Evenly between Ads, IAP”

As a Digital PR specialist and a member of the Society of Professional Journalists (SPJ), Max has 5+ years of writing experience.
Over the course of his career, Max’s work has garnered significant attention, with features in numerous prominent publications such as The New York Times, Forbes, Inc., Business Insider, Fast Company, Entrepreneur, BBC, TechRepublic, Glassdoor, and G2.