Welcome to your one-stop hub for screen time statistics.
Whether you’re a data enthusiast, a curious parent, or an industry professional, our list of the most up-to-date stats will help you navigate the pixelated labyrinth of the screen time world.
Let’s make a start.
Top Screen Time Statistics (Editor’s Picks)
- People worldwide spend an average of 6 hours and 37 minutes of screen time daily.
- The daily screen time for the average American is 6 hours and 59 minutes.
- As of April 2022, the average daily phone usage time in the US, excluding phone calls, is 4 hours and 30 minutes. It’s projected to increase to ~4 hours and 39 minutes by 2024.
| Daily Nonvoice Mobile Phone Usage in the US (2019–2024) | In Minutes |
|---|---|
| 2019 | 225 |
| 2020 | 256 |
| 2021 | 264 |
| 2022 | 270 |
| 2023 | 276 |
| 2024 | 279 |
- The average individual checks their smartphone 58 times a day.
- In 2023, it’s estimated that US adults spend about 2 hours and 33 minutes daily watching TV.
- Experts recommend that adults keep their screen time below two hours per day, excluding work.

- Children (ages eight and 18) spend 7.5 hours per day in front of a screen for entertainment, with 4.5 hours dedicated to TV.
| Daily Screen Time Across Different Age Groups | In Hours |
|---|---|
| 8–10 | 6 |
| 11–14 | 9 |
| 15–18 | 7.5 |
General Screen Time Stats, Facts, and Trends
- People worldwide spend an average of 6 hours and 37 minutes using the internet across all devices.
| Daily Internet Usage Worldwide | Average Screen Time in Hours | Change Over the Previous Year |
|---|---|---|
| Q3 2013 | 6:09 | – |
| Q3 2014 | 6:23 | +3.8% |
| Q3 2015 | 6:20 | −0.8% |
| Q3 2016 | 6:29 | +2.4% |
| Q3 2017 | 6:46 | +4.4% |
| Q3 2018 | 6:48 | +0.5% |
| Q3 2019 | 6:38 | −2.5% |
| Q3 2020 | 6:54 | +4% |
| Q3 2021 | 6:58 | +1% |
| Q3 2022 | 6:37 | −4.8% |
- South Africa spends more time online daily than any other country: 9 hours and 38 minutes, on average.
| Selected Countries | Daily Internet Usage in Hours |
|---|---|
| South Africa | 9:38 |
| Brazil | 9:32 |
| Philippines | 9:14 |
| Argentina | 09:01 |
| Colombia | 09:01 |
| Chile | 8:36 |
| Mexico | 8:07 |
| Malaysia | 8:06 |
| Thailand | 8:06 |
| United States | 6:59 |
| Worldwide | 6:37 |
- In contrast, the Japanese spend the least time online daily, with an average of 3 hours and 45 minutes.
- Among global internet users aged 16 to 64, 92.3% access the internet via mobile phones, while 65.6% rely on computers.
- As of January 2022, mobile phones make up 53.5% of internet users’ online time, a 1.3% increase from the previous year.
- Most Americans (85%) go online every day.
| How Often Do You Go Online? | Share |
|---|---|
| Almost constantly | 31% |
| Several times a day | 48% |
| About once a day | 6% |
| Several times a week | 4% |
| Less often | 4% |
| Never | 7% |
- TV claims the largest chunk of Americans’ screen-based leisure time (34%).
| Americans’ Screen-Based Leisure Time: Breakdown | Share |
|---|---|
| TV | 34% |
| Gaming | 16% |
| Movies | 14% |
| Online videos | 12% |
| Social media | 9% |
| Reading ebooks | 6% |
| Other | 9% |
- As of April 2022, the average daily phone usage time in the US, excluding phone calls, is 4 hours and 30 minutes. It’s projected to increase to ~4 hours and 39 minutes by 2024.
| Daily Nonvoice Mobile Phone Usage in the US (2019–2024) | In Minutes |
|---|---|
| 2019 | 225 |
| 2020 | 256 |
| 2021 | 264 |
| 2022 | 270 |
| 2023 | 276 |
| 2024 | 279 |
- The average individual checks their smartphone 58 times a day.
- Nearly 96.6% of internet users have a mobile phone of some kind.
| Device Kind | Ownership Share |
|---|---|
| Any mobile phone | 96.6% |
| Laptop or desktop computer | 63.1% |
| Tablet | 34.8% |
| Games console | 20.3% |
| Smartwatch or smart wristband | 27.4% |
| TV streaming device | 15.5% |
| Smart home device | 14.1% |
| Virtual reality device | 4.8% |
- Android phones comprise 72% of the total smartphone handsets currently in use.
| Mobile Web Traffic by Mobile Operating System | Share |
|---|---|
| Android | 71.96% |
| iOS | 27.48% |
| Samsung OS | 0.34% |
| Kai OS | 0.07% |
| Other OS | 0.15% |
- As of 2023, it’s estimated that the average daily TV viewing time for US adults is around 2 hours and 33 minutes. By 2024, that number will decrease to 2 hours and 28 minutes.
| Daily TV Viewing Time in the US (2019–2024) | In Minutes |
|---|---|
| 2019 | 196.2 |
| 2020 | 199.8 |
| 2021 | 189.6 |
| 2022 | 184.2 |
| 2023 | 153 |
| 2024 | 147.6 |

Do you need passport photos? Find out more:
Screen Time vs. Children, Tweens, and Teens
- Children (ages eight and 18) spend 7.5 hours per day in front of a screen for entertainment, with 4.5 hours dedicated to TV.
| Daily Screen Time Across Different Age Groups | In Hours |
|---|---|
| 8–10 | 6 |
| 11–14 | 9 |
| 15–18 | 7.5 |
- More than half of US parents (51%) say they allow their children to have three or more hours of non-homework screen time daily.
- Almost half of parents express concerns about their children’s excessive screen time, finding it challenging to manage. Additionally, 21% feel guilty about how much time their kids spend on TVs or computers.
- Three-quarters (75%) feel hypocritical reprimanding their kids about excessive screen time when the adults in the household are equally guilty.
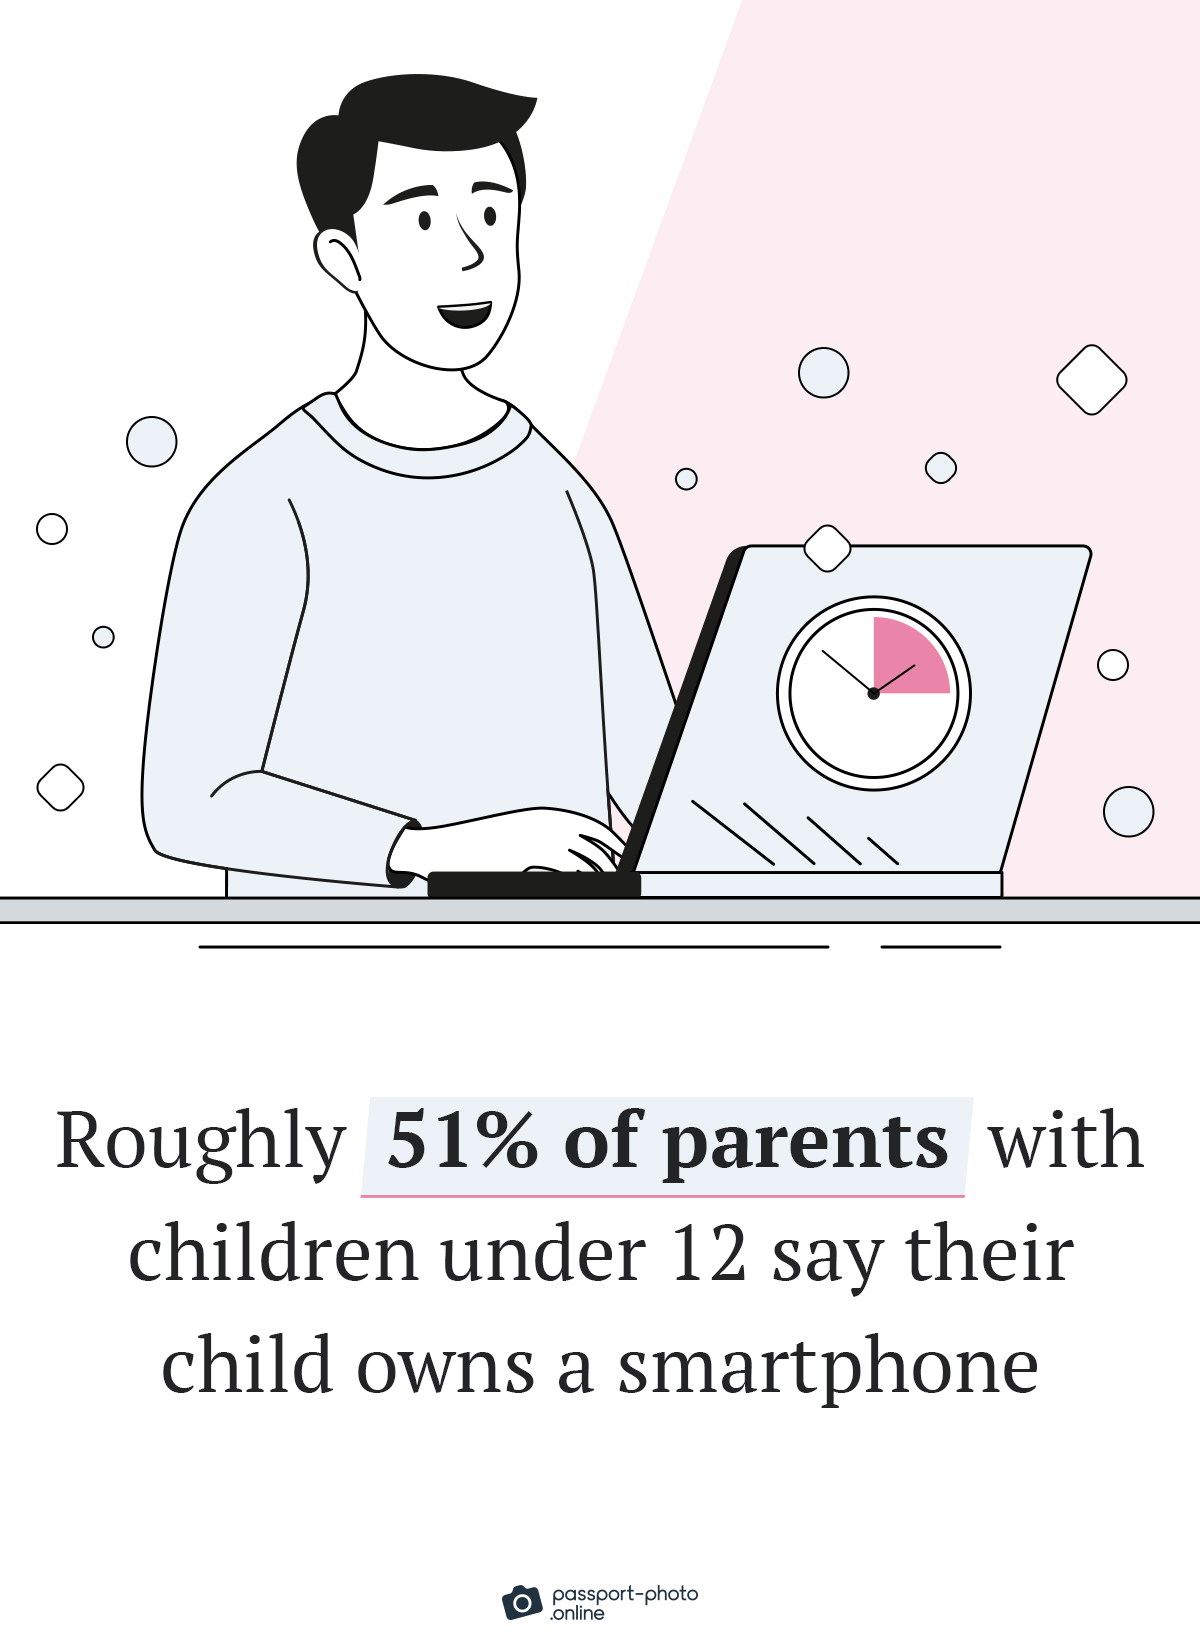
- Roughly 51% of parents with children under 12 say their child owns a smartphone.

- Six in 10 parents (60%) with a child under 12 say their child started using a smartphone before age five.
- Among parents whose child uses a smartphone, 26% report that smartphone usage started between the ages of five and eight. For parents with a child aged nine to 11, this percentage drops to 14%.
- Most parents of children under 12 who have smartphones state the ease of reaching their child (78%) is a significant factor in getting them a smartphone.
- Among 8- to 18-year-olds, watching online videos is the top media activity.
- When asked to choose, teens claim that YouTube (32%) is the site they can’t imagine living without.
| Sites and Social Media Apps Teens (13–18) Can’t Imagine Living Without | Share |
|---|---|
| YouTube | 32% |
| Snapchat | 20% |
| TikTok | 13% |
| 13% | |
| Discord | 6% |
| 6% | |
| 3% | |
| 2% | |
| 2% | |
| Tumblr | 1% |
- About 38% of tweens have used social media, while 18% use it daily.
- Among the social media sites tweens have used, Snapchat (13%), Instagram (10%), Facebook (8%), Discord (5%), and Pinterest (4%) rank as the top five.
- Teenagers now spend an average of 1 hour and 27 minutes per day on social media, up from 1 hour and 10 minutes in 2019.
- Almost half (46%) of teenagers aged 13 to 18 have engaged in podcast listening, and one in five reports doing so weekly.
- The television is the most prevalent device for young children, with 88% of parents indicating their child uses or interacts with it.
| Children’s (11 or Younger) Engagement with Certain Types of Digital Devices according to Their Parents | Share |
|---|---|
| Television | 88% |
| Tablet | 67% |
| Smartphone | 60% |
| Desktop or laptop computer | 44% |
| Gaming device | 44% |
Screen Time and Well-Being
- It takes the typical adult less than 10 minutes to look at a screen after waking up.
- People diagnosed with smartphone addiction face challenges in the brain’s messaging system and demonstrate diminished cognitive abilities.
- Setting a 30-minute daily limit on social media usage yields a meaningful boost in well-being.
- People who dedicate six hours or more daily to screen time face an increased risk of depression.
- Most adults (70%) admit to feeling eye strain caused by prolonged screen exposure.
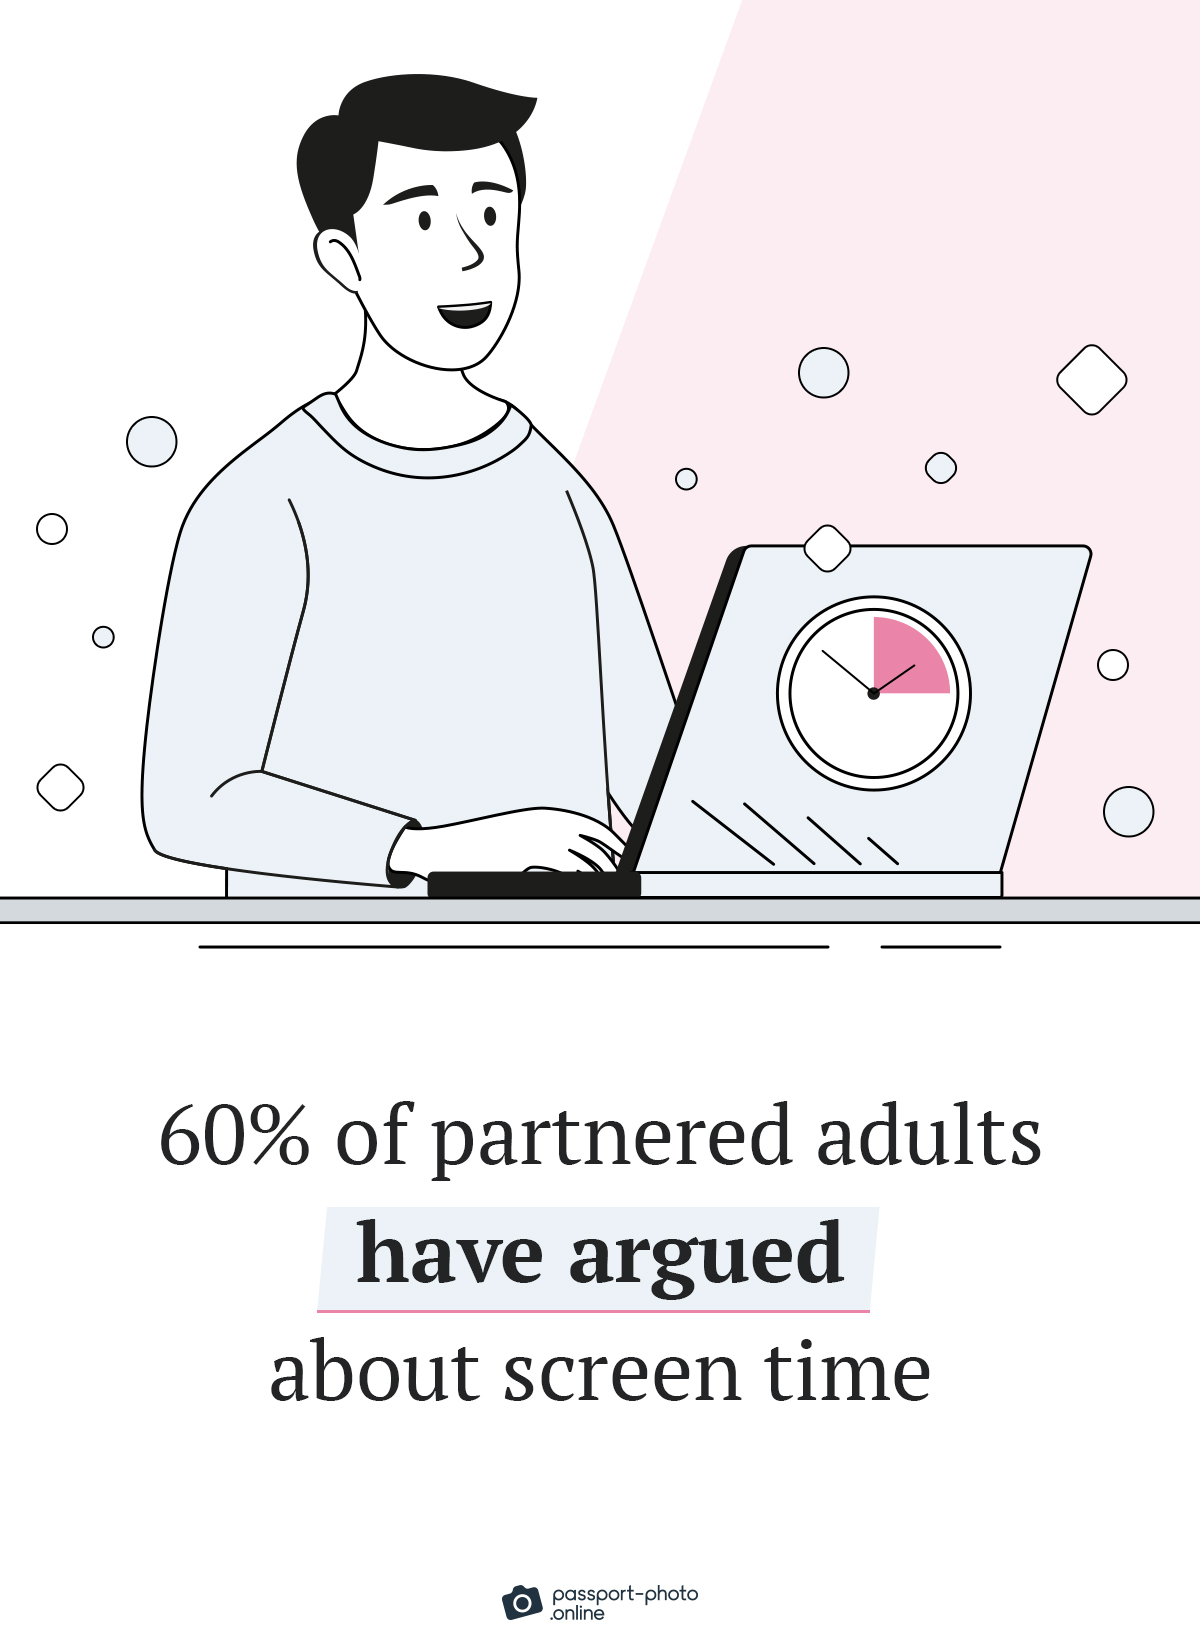
- About 60% of adults in relationships have argued with their partners regarding how much time they spend staring at screens.

- Experts recommend that adults keep their screen time below two hours per day, excluding work.
Stacking It All Up
There you have it.
A comprehensive list of screen time statistics, facts, and trends.
Let us know in the comments if there are any other stats you’d like to see.
FAQ
What’s the average screen time for adults?
How many hours of screen time is healthy?
How much time does the average person spend on their phone?
How often do people check their phones?
How many hours does the average American spend watching TV?
What country has the highest screen time?
Fair Use Statement
Did you like our infographics? If so, feel free to share them with your audience. Just remember to mention the source and link back to this page.
Sources
- CDC, “Screen Time vs. Lean Time”
- Common Sense Media, “Media Use by Tweens and Teens”
- DataReportal, “Digital 2023: Global Overview Report”
- Guilford Publications, “No More FOMO: Limiting Social Media Decreases Loneliness and Depression”
- Insider Intelligence, “Most US Parents Give Their Children Several Hours of Screen Time Each Day”
- Marketing Charts, “Americans’ Screen Time Activities Evolve Away from TV & Movies”
- National Library of Medicine, “Association between Screen Time and Depression among US Adults”
- Passport Photo Online, “49+ Smartphone Usage Statistics, Facts, and Trends”
- People, “Average US Adult Will Spend Equivalent of 44 Years Staring at Screens: Poll”
- Pew Research Center, “31% of American Adults Are Online Almost Constantly”
- Pew Research Center, “Children’s Engagement with Digital Devices, Screen Time”
- Reid Health, “How Much Screen Time is Too Much for Adults?”
- ScienceDirect, “Structural and Functional Correlates of Smartphone Addiction”
- Statista, “Average Daily Time Spent Watching TV in the United States from 2019 to 2024”
- Statista, “Time Spent with Nonvoice Activities on Mobile Phones Every Day in the United States from 2019 to 2024”

As a Digital PR specialist and a member of the Society of Professional Journalists (SPJ), Max has 5+ years of writing experience.
Over the course of his career, Max’s work has garnered significant attention, with features in numerous prominent publications such as The New York Times, Forbes, Inc., Business Insider, Fast Company, Entrepreneur, BBC, TechRepublic, Glassdoor, and G2.


