


Intrigued about the landscape of smartphone usage in 2026?
You’re in the right place.
We’ve gathered, categorized, and vetted a comprehensive list of the most up-to-date stats, facts, and trends for your convenience.
Let’s dive right in.
Top Smartphone Usage Stats (Editor’s Picks)
- A full 96% of young Americans (18–29) are smartphone owners.
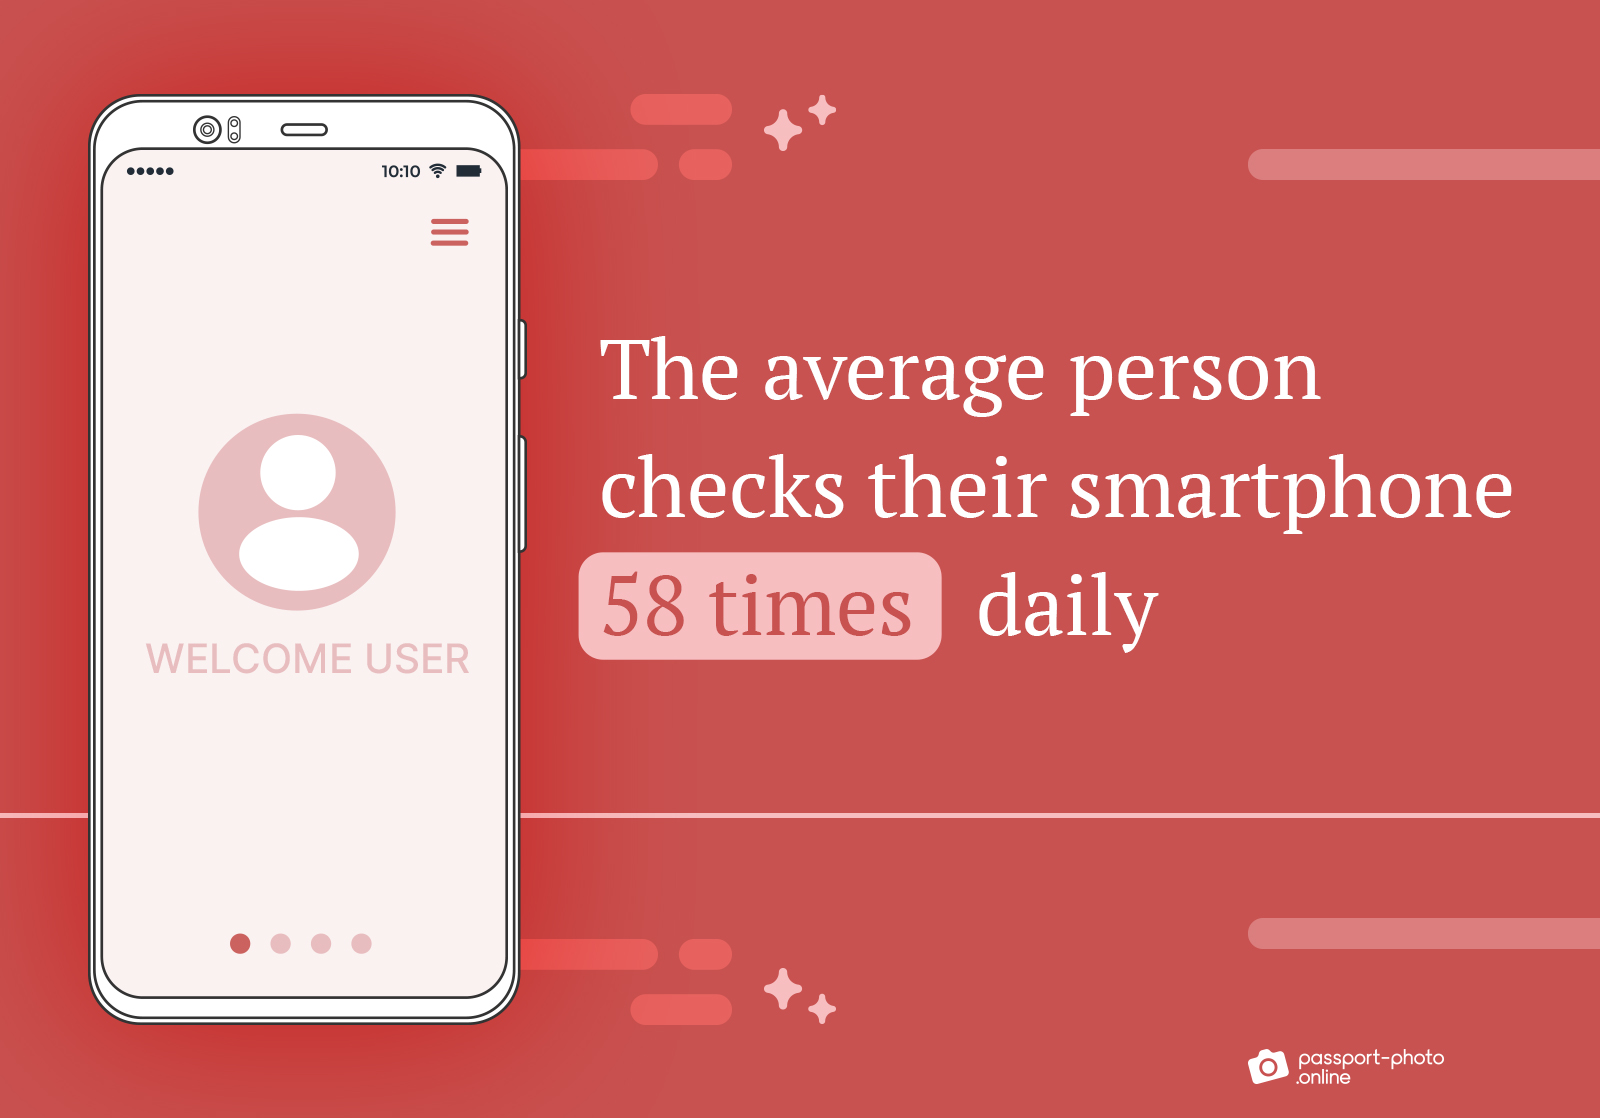
- The average person checks their smartphone 58 times daily.
- Roughly 85% of Americans own a smartphone, a major increase from 35% in 2011.
- Almost all Americans (97%) have a cellphone, either a smartphone or a non-smartphone.
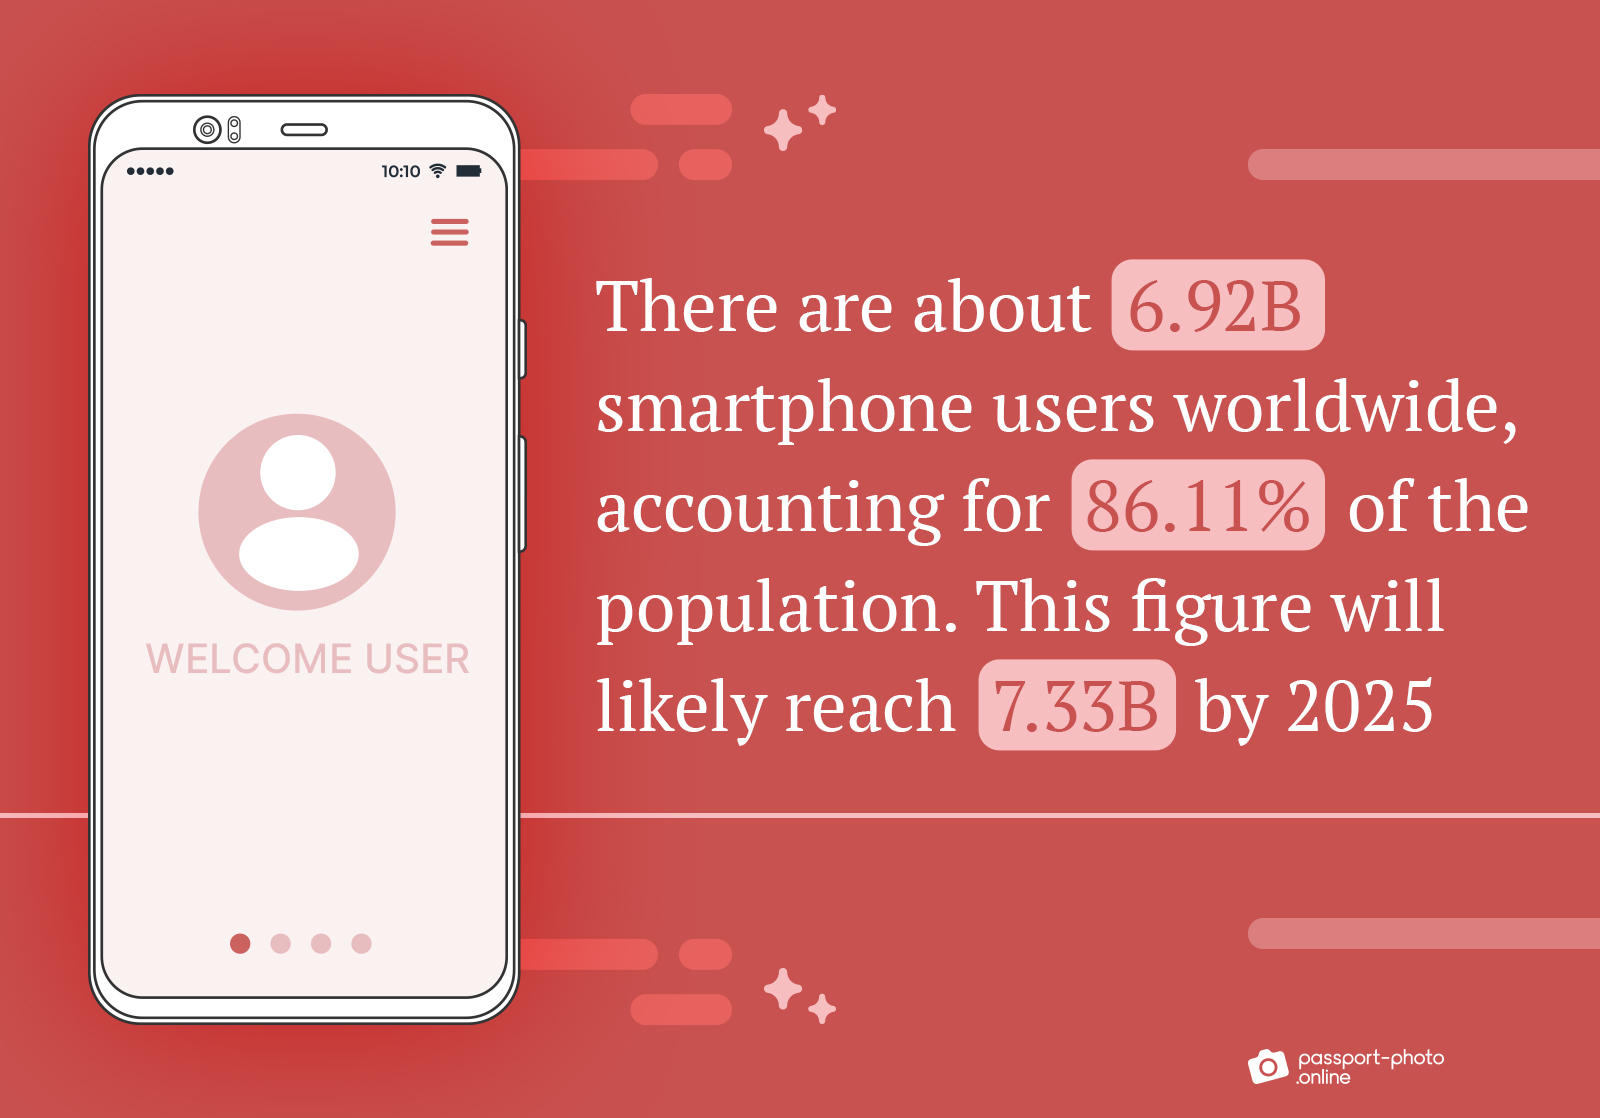
- There are about 6.92B smartphone users worldwide, accounting for 86.11% of the population. This figure will likely reach 7.33B by 2025.
- There are 7.33B people using mobile phones (smartphones or non-smartphones) worldwide, accounting for 91.21% of the population.
- In 2025, 72% of internet users will access the web exclusively through smartphones.
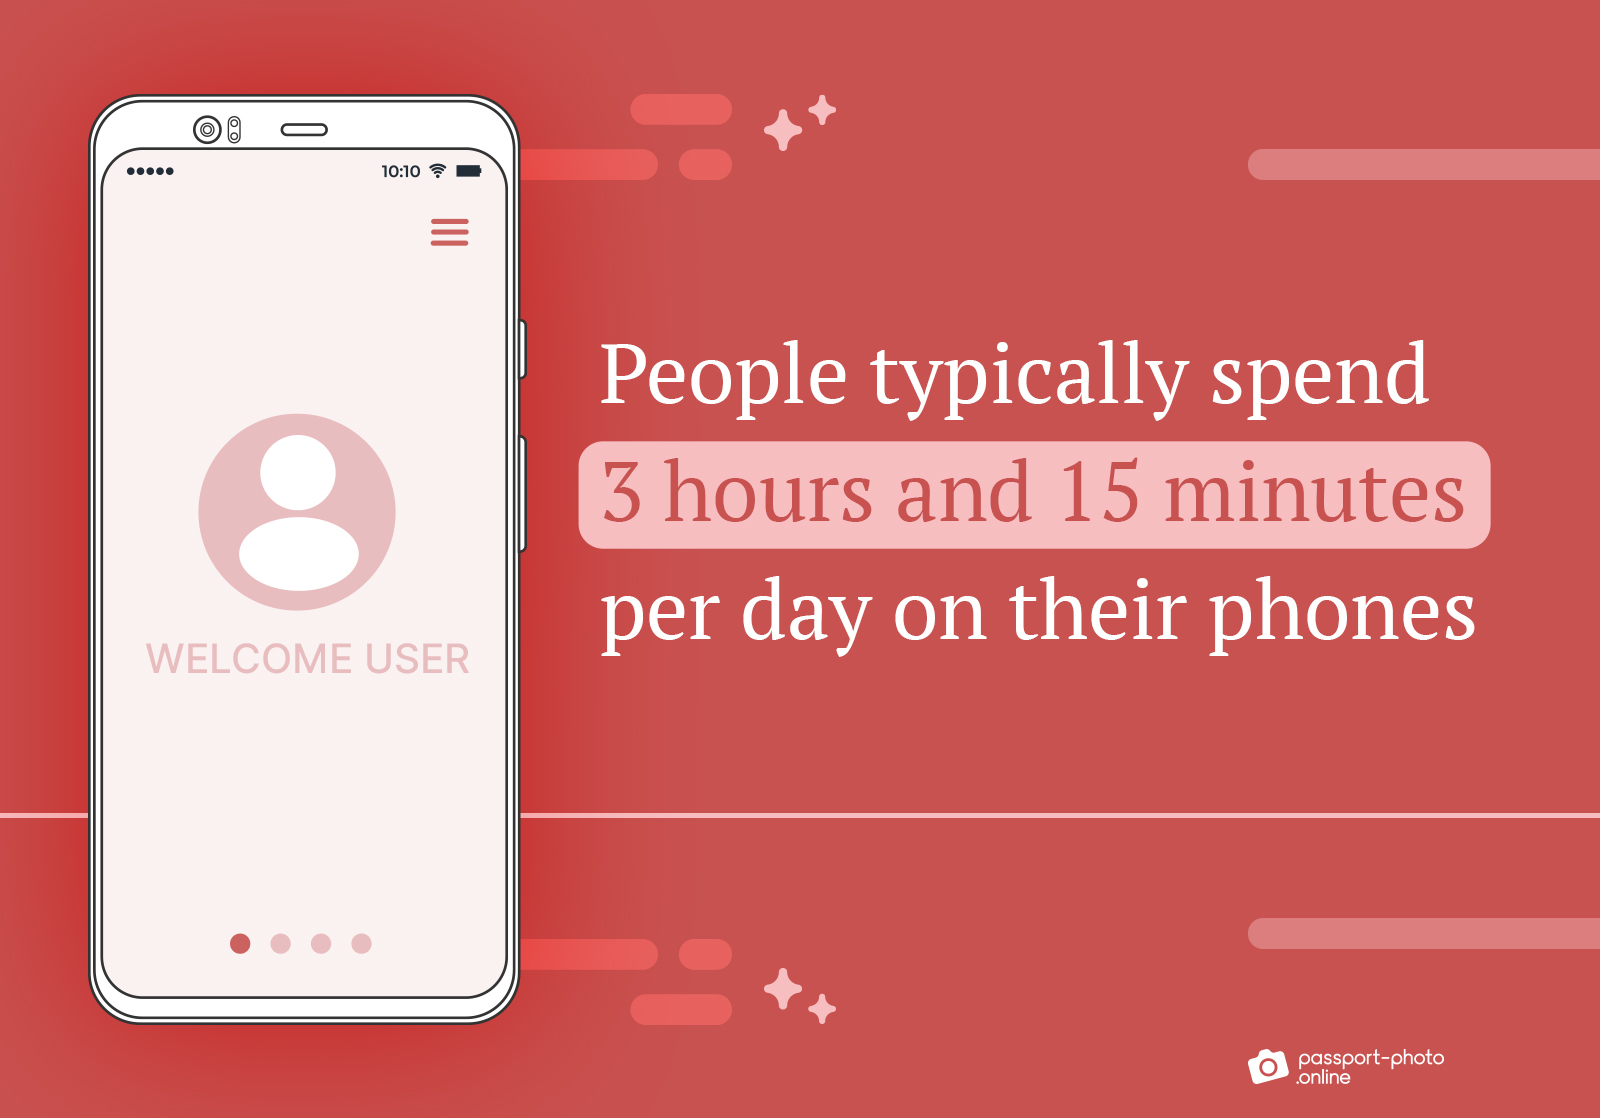
- People typically spend 3 hours and 15 minutes per day on their phones.
- Nearly 15% of American adults rely solely on smartphones for internet access.

Do you need passport photos? Find out more:
General Smartphone Usage Statistics, Facts, and Trends
- The global smartphone market is forecast to expand at a CAGR of 7.3% from 2022 to 2029, increasing its value from $484.81B to $792.51B.
- Smartphone sales revenue in the United States reached ~$102B in 2022, but it’s predicted to decrease to $97.31B by 2027.
- The global smartphone market revenue reached $418.88B in 2022.
| Global Smartphone Revenue (2014–2022) | In Billion US Dollars |
|---|---|
| 2022 | 418.88 |
| 2021 | 448.08 |
| 2020 | 381.72 |
| 2019 | 404.60 |
| 2018 | 410.09 |
| 2017 | 391.84 |
| 2016 | 367.18 |
| 2015 | 359.37 |
| 2014 | 325.53 |
- In 2022, China boasted the highest number of smartphone users (over 974M). In contrast, Bangladesh had the lowest count, with 52.03M users.
| Smartphone Users by Country (2022) | In Millions |
|---|---|
| China | 974.69 |
| India | 659 |
| United States | 276.14 |
| Indonesia | 187.70 |
| Brazil | 143.43 |
- The global smartphone penetration rate reached 68% in 2022, marking an increase for the first time since 2018, when it stood at 67%.
| Global Smartphone Penetration (as a Share of the Population) from 2016 to 2022 | In % |
|---|---|
| 2022 | 68 |
| 2021 | 67 |
| 2020 | 67 |
| 2019 | 67 |
| 2018 | 67 |
| 2017 | 66 |
| 2016 | 65 |
- The United States has a smartphone penetration rate of 81.6% as of 2022.
| Smartphone Penetration Rate in Chosen Countries (2022) | In % |
|---|---|
| France | 82.60 |
| United Kingdom | 82.20 |
| Germany | 81.90 |
| United States | 81.60 |
| Japan | 78.60 |
| Turkey | 75 |
| Iran | 74.40 |
- In 2022, smartphone sales in the US reached $74.7B.
| Smartphone Sales in the US (2017–2022) | In Billion US Dollars |
|---|---|
| 2022 | 74.70 |
| 2021 | 73 |
| 2020 | 79 |
| 2019 | 77.50 |
| 2018 | 79.10 |
| 2017 | 69 |
- The global smartphone unit shipments totaled 1,225.4M.
| Global Smartphone Shipments (2017–2022) | In Millions |
|---|---|
| 2022 | 1,225.40 |
| 2021 | 1,391.50 |
| 2020 | 1,331.20 |
| 2019 | 1,479.10 |
| 2018 | 1,505.20 |
| 2017 | 1,566.50 |
- On average, ~1,447.97M smartphones are sold annually.
- The US recorded the shipment of around 128M smartphones in 2022, with an anticipated decrease to 110.56M by 2027.
| Smartphone Shipments in the United States (2020–2027) | In Millions |
|---|---|
| 2027 | 110.56 |
| 2026 | 113.81 |
| 2025 | 116.97 |
| 2024 | 119.93 |
| 2023 | 123.53 |
| 2022 | 127.98 |
| 2021 | 139.91 |
| 2020 | 125.05 |
- As of 2023, the average price for a consumer smartphone in the US is ~$720, while a business smartphone costs $824.
- A full 95% of adults in the US aged 18 to 49 have a smartphone, while among adults aged 65 and older, the smartphone penetration rate is only 61%.
| Smartphone Ownership in the United States by Age (2015–2021) | 18–29 | 30–49 | 50–64 | 65+ |
|---|---|---|---|---|
| 2021 | 95 | 95 | 83 | 61 |
| 2019 | 96 | 92 | 79 | 53 |
| 2018 | 94 | 89 | 73 | 46 |
| 2017 | 94 | 89 | 73 | 46 |
| 2016 | 92 | 88 | 74 | 42 |
| 2015 | 86 | 83 | 58 | 30 |
- In the US, 85% of men and women have smartphones.
- During H1 2022, daily mobile device usage in the US increased by 8.9% compared to H1 2021.
- The most common smartphone activity is chatting/sending messages (76%), followed by emailing (71%) and listening to music (61%).
| Primary Smartphone User Activities Worldwide (Jul 2021 – Jun 2022) | In % |
|---|---|
| Chatting or sending messages | 76 |
| Emailing | 71 |
| Listening to music | 61 |
| Online banking | 61 |
| Watching videos | 61 |
- In 2022, US adults devoted 3 hours and 19 minutes per day to their smartphones, surpassing the time spent watching TV (3 hours and 7 minutes) for the first time. By 2024, adults will spend an additional 43 minutes on smartphones compared to TVs.
- Mobile phones accounted for 58.32% of web page views globally in 2022.
- The global count of smartphone mobile network subscriptions reached ~6.6B in 2022 and is projected to surpass 7.8B by 2028.
- Global smartphone usage in 2022 averaged 15 gigabytes of mobile data per month, increasing from 11.8 gigabytes in the previous year. Projections anticipate this number to reach 19 gigabytes in 2023 and 45.9 gigabytes by 2028.
| Global Mobile Data Traffic per Smartphone (2016–2028) | In GB/Month |
|---|---|
| 2028 | 45.91 |
| 2027 | 40.05 |
| 2026 | 33.77 |
| 2025 | 28.12 |
| 2024 | 23.10 |
| 2023 | 19.08 |
| 2022 | 14.99 |
| 2021 | 11.81 |
| 2020 | 9.10 |
| 2019 | 6.57 |
| 2018 | 4.76 |
| 2017 | 2.52 |
| 2016 | 1.86 |
- Global monthly mobile data usage by smartphones in 2022 reached 86.7 exabytes, with growth from 64.8 exabytes in the previous year. Projections foresee a monthly mobile data traffic of 314.8 exabytes by 2028.
Mobile Operating Systems
- Android continued to dominate as the top mobile OS globally in Q1 2023, capturing a market share of 71.4%. Apple’s iOS, its closest competitor, held a market share of 27.9%.
| Global Mobile Operating System Market Share (2021–2023) | Android | iOS |
|---|---|---|
| 1Q’23 | 71.44 | 27.89 |
| 4Q’22 | 71.75 | 27.64 |
| 3Q’22 | 71.64 | 27.71 |
| 2Q’22 | 71.72 | 27.58 |
| 1Q’22 | 70.78 | 28.46 |
| 4Q’21 | 70.62 | 28.66 |
| 3Q’21 | 72.47 | 26.70 |
| 2Q’21 | 72.58 | 26.60 |
| 1Q’21 | 71.88 | 27.41 |
- Apple’s iOS and Google’s Android lead the US market with shares of around 57% and 43%, respectively.
| Share of Mobile OS in the US (2023, Monthly Breakdown) | iOS | Android |
|---|---|---|
| Mar ’23 | 56.94 | 42.65 |
| Feb ’23 | 57.06 | 42.61 |
| Jan ’23 | 57.77 | 41.85 |
- In May 2023, Android users accounted for 37.47% of the US population.
- As of January 2023, around 25% of mobile Android devices worldwide use version 12 of Google’s operating system.
- In February 2023, iOS 16 was installed on 81% of Apple devices accessing the App Store, while iOS 15 was running on 15% of mobile devices.
Smartphone Companies
- The smartphone industry is primarily dominated by Apple (31.6%) and Samsung (25.28%), accounting for a combined market share of 56.88%.
| Top Mobile Vendors | Global Market Share (May 2023) |
|---|---|
| Apple | 31.6% |
| Samsung | 25.28% |
| Xiaomi | 11.12% |
| Oppo | 6.47% |
| Vivo | 4.87% |
- In 2022, smartphone shipments worldwide reached 1.21B units. Samsung emerged as the top manufacturer, shipping 261M units, closely followed by Apple (266.4M).
- Samsung dominated as the top global smartphone vendor in Q1 2023, shipping over 60M units, while Apple’s shipments reached nearly 55M.
- Apple’s global market share in smartphone shipments has remained steady from 2014 to 2022, while Samsung’s fluctuatated. In contrast, Xiaomi has increased its market share by nearly 10 percentage points since 2014, becoming the third largest vendor.
| Global Market Share of Leading Smartphone Vendors (2019–2022) | Samsung | Apple | Xiaomi |
|---|---|---|---|
| 2022 | 21.70 | 18.70 | 12.70 |
| 2021 | 20 | 16.80 | 14 |
| 2020 | 20 | 16 | 11 |
| 2019 | 20.90 | 17 | 8.80 |
Smartphone Addiction
- Globally, people spend 3 hours and 15 minutes daily on their phones.
- In the US, the average daily phone usage time, excluding phone calls, has reached 4 hours and 30 minutes as of April 2022. It’s anticipated to rise to around 4 hours and 39 minutes by 2024.
| Time Spent on Nonvoice Activities on Mobile Phones Daily in the US (2019–2024) | In Minutes |
|---|---|
| 2024 | 279 |
| 2023 | 276 |
| 2022 | 270 |
| 2021 | 264 |
| 2020 | 256 |
| 2019 | 225 |
- The average person checks their smartphone 58 times daily.
- Most Americans (89%) check their phones within 10 minutes of waking up.
- Leaving one’s phone at home makes 75% of Americans feel uneasy.
- About 75% of Americans check their phones within five minutes of getting a notification.
- Over half of people (57%) admit to being addicted to their phones.
- A significant majority (55%) report they’ve never gone over 24 hours without their cell phone.
- Approximately 17% of women in the US have interrupted bedroom intimacy to check their smartphones.
Smartphone Use on Vacation
- About 75% of American travelers regard their smartphone as the #1 travel accessory.
- The majority of US travelers (71%) check their cell phones an average of 32 to 80 times per day, with 10% admitting to taking a peek about 160 times daily.
- Close to 68% of employees use mobile devices for work while on vacation.
- Roughly 62% of travelers acknowledge that using smartphones for work prevented them from relaxing and recharging their batteries.
Stacking It All Up
There you have it.
A comprehensive list of smartphone usage statistics, facts, and trends.
Let us know in the comments if there are any other stats you’d like to see.
FAQ
How many people have smartphones?
How much time does the average person spend on their phone?
What percentage of the US has cell phones?
What’s the global penetration rate of smartphones?
Who dominates the smartphone market?
How often do people check their phones?
What’s the projected growth of the smartphone market?
How many smartphones are sold every year?
How common is phone addiction?
Fair Use Statement
Did you like our infographics? If so, feel free to share them with your audience. Just remember to mention the source and link back to this page.
Sources
- Apple, “App Store – Support”
- Counterpoint Research, “Global Smartphone Revenue Hits Record ~$450 Billion in 2021; Apple Captures Highest Ever Share in Q4 2021”
- Daniel Research Group, “Understanding The Future”
- Ericsson, “Ericsson Mobility Visualizer – Mobility Report”
- GlobeNewswire, “Smartphone Market Size [2022–2029]”
- GSMA, “The Mobile Economy 2023”
- IDC, “Smartphone Market Woes Continue with 14.6% Drop in First Quarter This Year”
- IDC, “Smartphone Shipments Suffer the Largest-Ever Decline with 18.3% Drop in the Holiday Quarter and an 11.3% Decline in 2022”
- Insider Intelligence, “How Mobile Users Spend Their Time on Their Smartphones in 2023”
- Insider Intelligence, “US Time Spent with Connected Devices 2022”
- Newzoo, “Top Countries/Markets by Smartphone Penetration & Users”
- Passport Photo Online, “Smartphone Use On Vacation [2022 Study]”
- Pew Research Center, “Demographics of Mobile Device Ownership and Adoption in the United States”
- Reviews.org, “Cell Phone Usage in 2023”
- SellCell, “Smartphone Relationship Survey: 71% of People Spend More Time with Their Phone than Their Romantic Partner”
- Statcounter Global Stats, “Mobile Operating System Market Share United States Of America”
- Statista, “Smartphones in the US – Statistics & Facts”
- Statista, “Smartphones – Statistics & Facts”
- Strategy Analytics, “Apple Hits Best Fourth Quarter Global Smartphone Market Share Ever in Q4 2022”
- TrendForce, “Global Smartphone Production Fell by 15.5% YoY to 301 Million Units for 4Q22 Due to Underwhelming Busy Season”

As a Digital PR specialist and a member of the Society of Professional Journalists (SPJ), Max has 5+ years of writing experience.
Over the course of his career, Max’s work has garnered significant attention, with features in numerous prominent publications such as The New York Times, Forbes, Inc., Business Insider, Fast Company, Entrepreneur, BBC, TechRepublic, Glassdoor, and G2.