


When did Instagram start? Who has the most IG followers? Do hashtags still boost engagement? How people use Instagram?
Now—
Wouldn’t it be nice to have the ultimate collection of Instagram statistics all in one place?
Whether you’re a social media marketer, an influencer, or just a casual Instagrammer, we’ve put together the most useful and recent IG stats, facts, and trends out there, so you can see what one of the biggest photo- and video-sharing apps is like in numbers.
Scroll on.
Fun Facts about Instagram
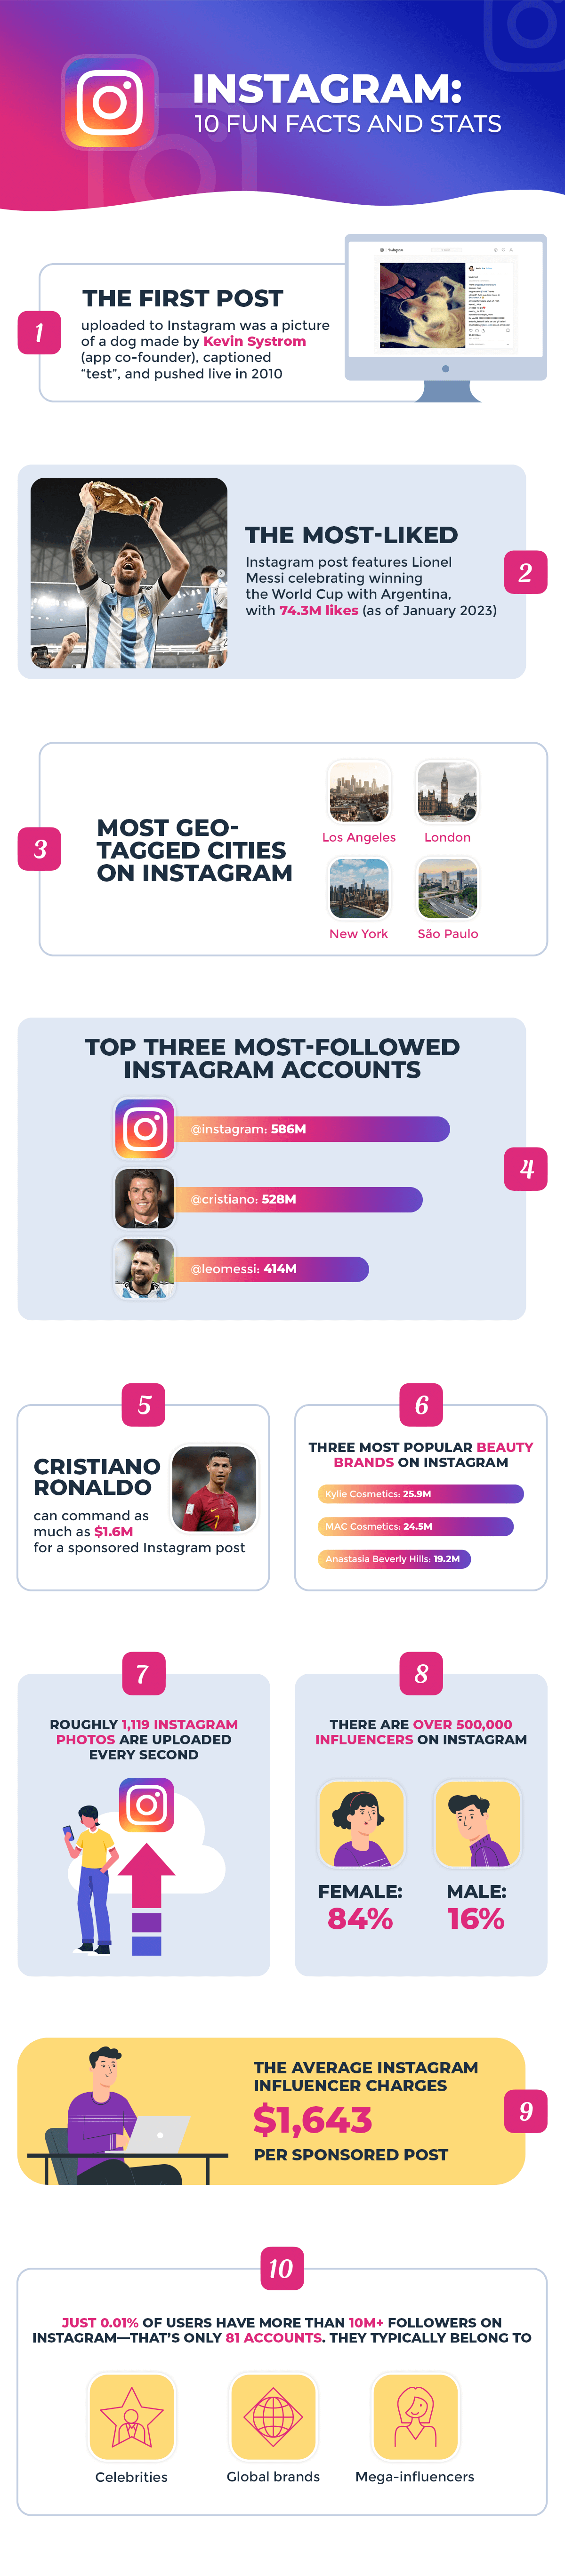
- The first post uploaded to Instagram was a picture of a dog made by Kevin Systrom (app co-founder), captioned “test,” and pushed live on July 16, 2010.
- The most-liked Instagram post features Lionel Messi celebrating winning the World Cup with Argentina, with 74.3M likes as of January 2023.
- The most geo-tagged city in the world is Los Angeles, followed by London, New York, and São Paulo.
- The most followed Instagram account is @instagram itself, with 586M followers as of January 2023, followed by @cristiano (528M) and @leomessi (414M).
- Cristiano Ronaldo can command as much as $1.6M for a sponsored post.
- With 25.9M followers, Kylie Cosmetics is the most popular beauty brand on Instagram, followed by MAC Cosmetics (24.5M) and Anastasia Beverly Hills (19.2M).
- Roughly 1,119 Instagram photos are uploaded every second.
- There are over 500K influencers on Instagram. Of these, 84% are female.
- The average Instagram influencer charges $1,643 per sponsored post.
- Just 0.01% of users have more than 10M+ followers—that’s only 81 accounts. They typically belong to celebrities, global brands, and mega-influencers.
About the Instagram Company
- Instagram launched on October 6, 2010, turning just 12 years in 2022.
- Instagram is headquartered in Menlo Park, California.
- Two years later, Instagram was purchased by Facebook for $1B. It’s now worth over $100B.
- Instagram Stories came out in August 2016.
- IGTV was released in June 2018.
- Reels first launched in Brazil as “Cenas” in November 2019.
- Adam Mosseri (@mosseri) is the head of Instagram.
General Stats about Instagram
- In November 2022, Instagram was the 7th most visited site globally with 4.5B monthly visits.
- In January 2023, Instagram was the second most-downloaded app in Google Play in the US, having 1B+ downloads.
- Most Instagrammers (54%) have fewer than 1K followers.
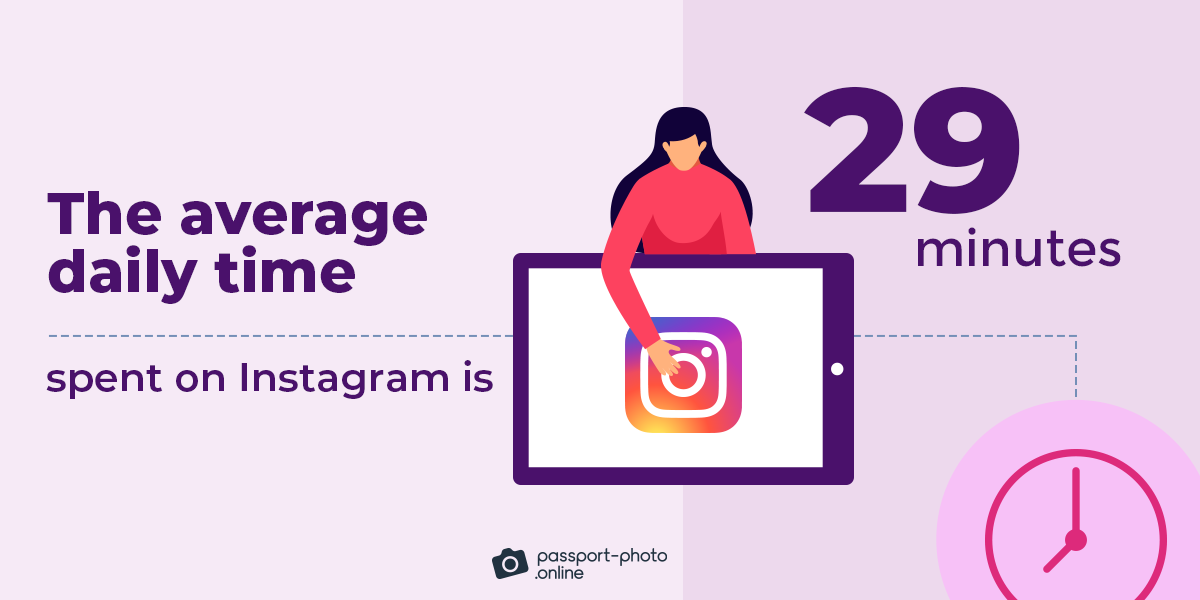
- The average daily time spent on Instagram is 29 minutes.
- The most popular reason to use Instagram is to see what friends and/or relatives are up to.
- Instagrammers spend 69% of their time watching videos on the platform.
- 25% of US Gen Zers consider Instagram the most important social network.
- Only 6% of US adults trust Instagram as a place to get political and election news.
Instagram Demographics
- Instagram had roughly 1.21B users worldwide in 2021, and it’s forecast to reach 1.44B MAUs by 2025.
- In January 2022, India had the largest Instagram audience, with over 230M users.
- In the US, Instagram has 159M+ registered users.
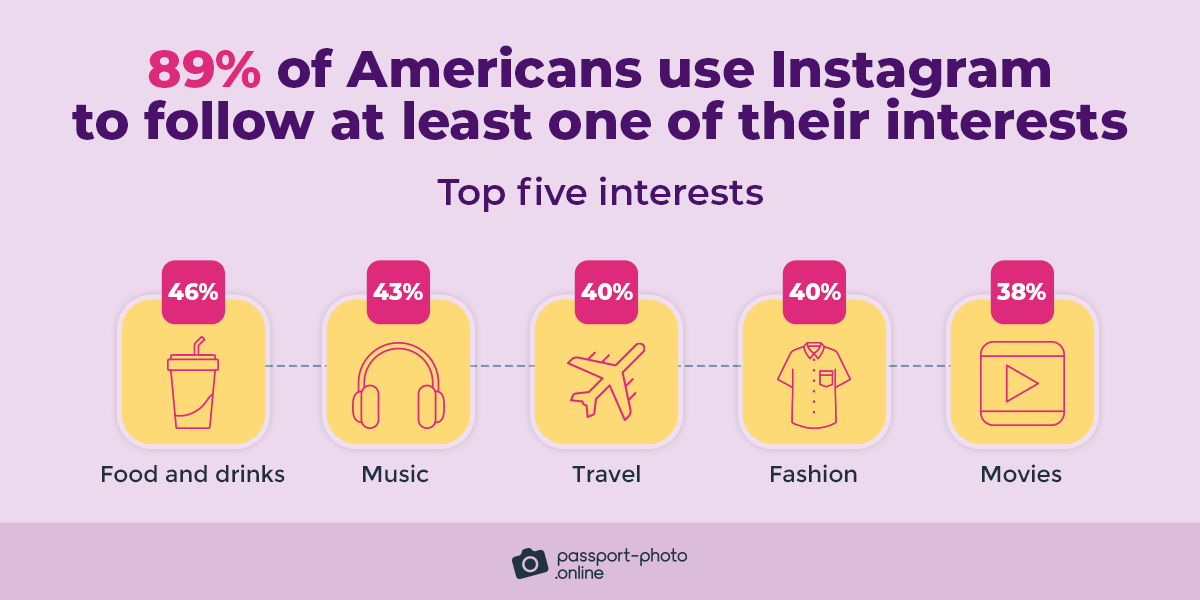
- Four in 10 Americans (40%) use Instagram. When it comes to Americans aged 18–29, that number jumps to 71%.
- In 2023, the photo- and video-sharing social network is expected to reach 127.2M monthly active US users.
- In April 2022, roughly 31% of global Instagram audiences were aged 25–34.
- More than half of Instagram users (52.2%) are male, and 47.8% are female.
- 59% of Americans use Instagram every day.
- 73% of US youngsters (aged 18–29) use IG daily. Of those, roughly half (53%) use it a few times per day.
Instagram Stories
- Over 500M people use Instagram Stories every day.
- Across the Meta family of apps, 1B Stories are shared daily.
- 45% of Instagram users prefer Stories to keep track of trends.
- 17% of audiences drop off after the first Story.
- People on Instagram exit faster from video Stories, with most exits occurring within the first two Stories.
- Instagram Stories have lower reach rates than posts in the feed.
- Reach-wise, image Stories slightly outperform video Stories.
- Adding up to five Stories a day allows for a retention rate of over 70%.
- The tap-forward rate for Stories was 68% in 2020.
- Both reach and impression rates go up to over 50% once viewers reach the eighth Story daily mark.
Instagram Posts
- The US has the most Instagram posts (571K), followed by Brazil (307K), the UK (121K), and India (102K).
- Highly engaging posts receive an average of 6,314 likes.
- Profiles with over 100K followers made 241 posts on average in 2019. In contrast, accounts with under 5K followers averaged only 50 posts.
- Most Instagram captions contain 10–30 words. Yet, writing shorter captions (with 10 words or fewer) boosts engagement. Here’s by how much for each type of content:
– Carousels: 3.13%
– Images: 2.54%
– Videos: 2.35%
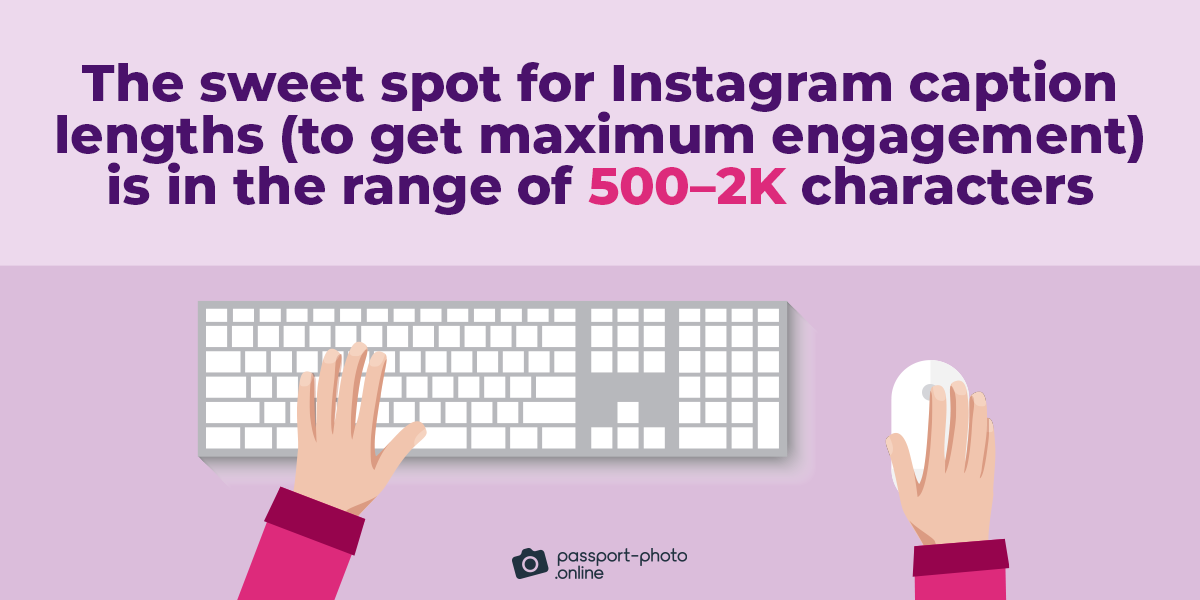
- The sweet spot for Instagram caption lengths (to get maximum engagement) is in the range of 500–2K characters.
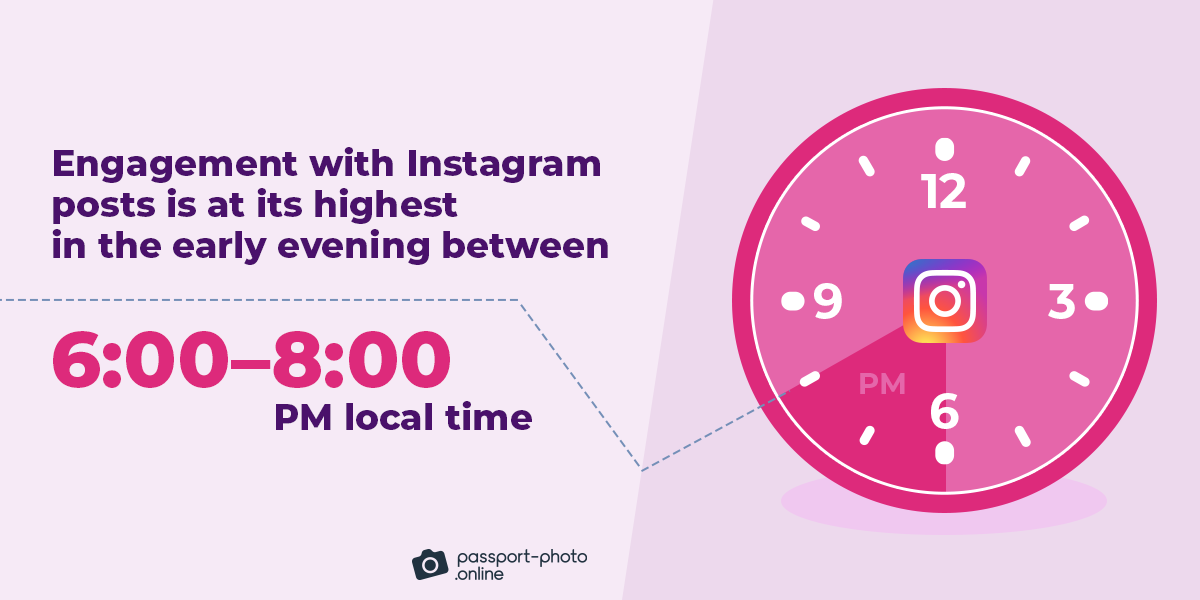
- Engagement with posts is at its highest in the early evening between 6:00 and 8:00 PM local time.
- On Sundays, Instagram posts are slightly more likely to be seen and engaged with.
- Location-tagged posts have 79% higher engagement than those without a tagged location.
- 46% of Instagram posts include questions, but it doesn’t affect engagement.
- Posts that can fit into “contest,” “giveaway,” and/or “DIY” categories are more engaging than regular ones.
- Emojis increase the engagement rate per post by an average of 0.5–1.32%.
- The face with tears of joy emoji 😂 was the most popular emoji of 2022. Images remain the most commonly used content format on Instagram and videos are a distant second (70% vs. 17%).
- Carousel posts generate the most engagement, with 62 likes and five comments on average.
- Tagged posts receive slightly more likes.
- In 2020, there were more likes on posts that had tags than those that didn’t.
Instagram # Hashtags
In 2021, the five hashtags with the highest engagement rate were:
– #bollywood
– #tbt
– #wildlife
– #couplegoals
– #tiktok
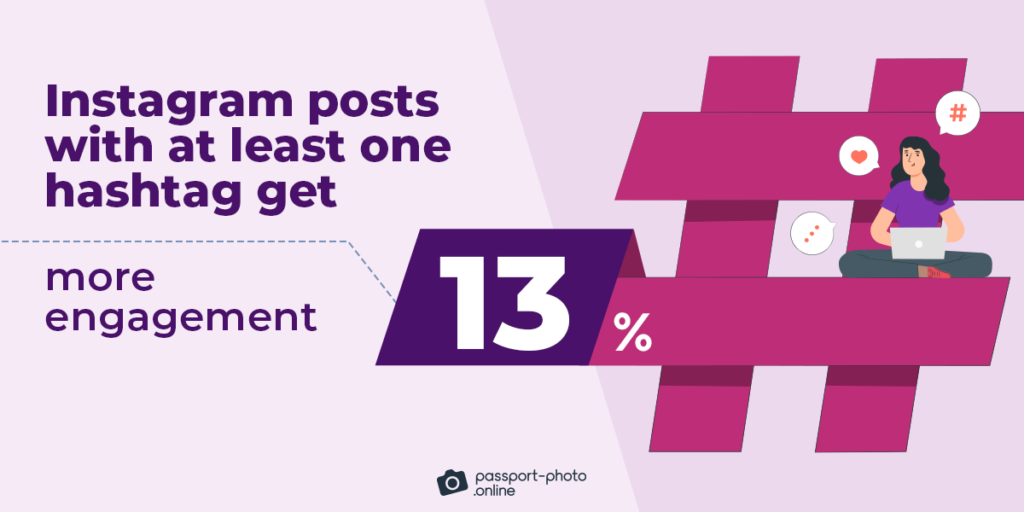
- Instagram posts with at least one hashtag get 13% more engagement.
- Highly engaging posts have an average of 5.44 hashtags.
- The average Instagram post has 6.93 hashtags.
- Posts with 27–30 hashtags don’t bring the best engagement.
- Instagram posts with hashtags in the first comment get a few more likes.
- Instagram posts with hidden hashtags in the caption are generally more engaging.
Instagram for Business: Stats
- There are over 25M business profiles on Instagram.
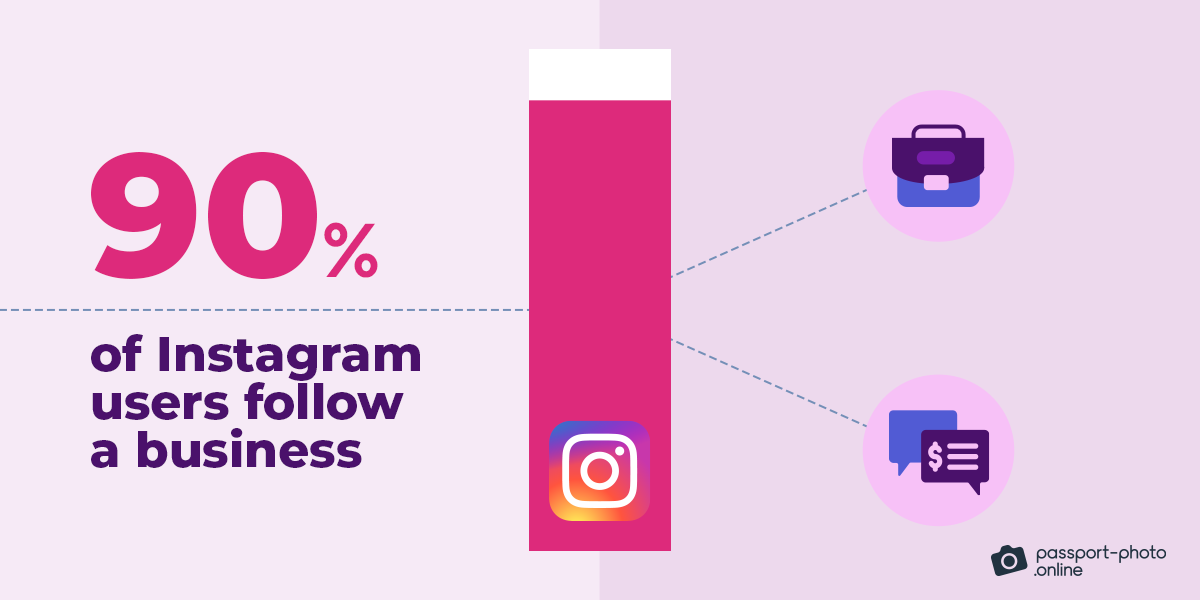
- 90% of Instagram users follow a business.
- 200M+ people visit at least one business profile every day.

- 130M+ Instagrammers tap on shopping posts to learn more about a business’s products or services every month.
- 70% of shoppers use Instagram for product discovery.
- More than 50% of Instagram accounts use “Explore” to discover photos and videos related to their interests.
| What Americans Say Instagram Helps Them With | Share |
|---|---|
| Discover new products or services | 83% |
| Decide whether to buy a product or service | 81% |
| Research products or services | 80% |
- 56% of Americans made a purchase either in the moment or after seeing it on Instagram.
- 55% of fashion shoppers made a purchase thanks to an Instagram creator’s post.
- 50% of people visited a site to buy a product or service after seeing it in Stories.
- 31% of Instagram users made a purchase after watching a video ad on the platform.
| Actions Americans Took after Seeing a Product or Service on Instagram | Share |
|---|---|
| Searched for more information | 79% |
| Visited the brand’s site or app | 67% |
| Made a purchase online or offline | 47% |
| Visited a retail shop | 35% |
| Followed the brand’s account online | 33% |
| Talked to someone about it: | 32% |
- 50% of people are more interested in a brand when they see its ads on Instagram.
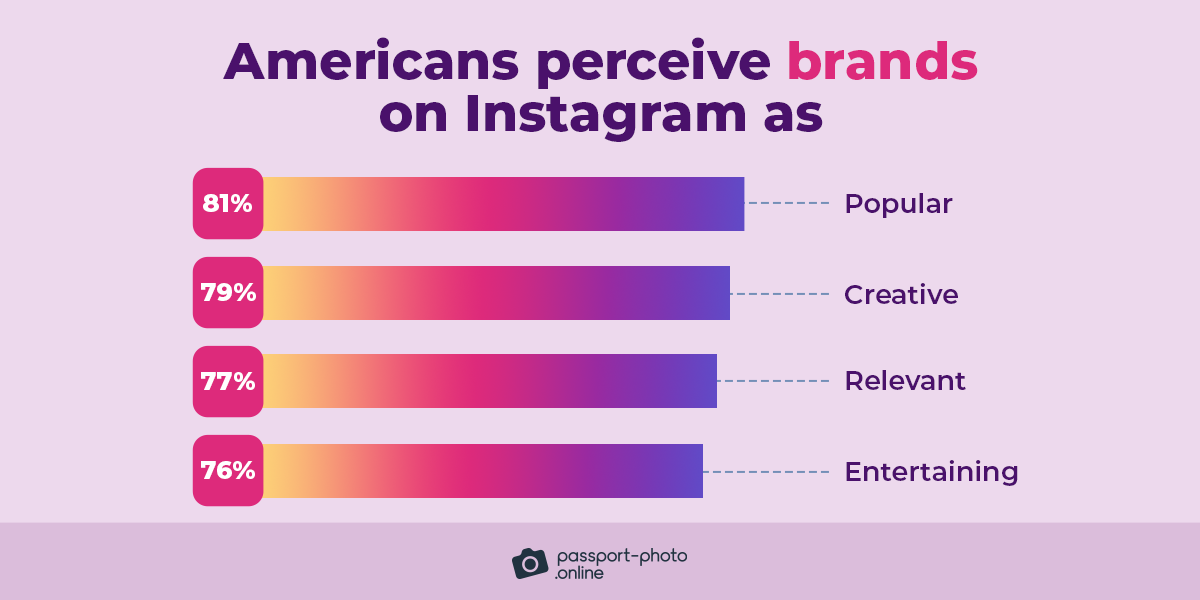
- Americans perceive brands on Instagram as popular (81%), creative (79%), relevant (77%), and entertaining (76%).
- Over 66% of people believe Instagram enables interaction with brands.
- 18% of Instagram users discover new brand accounts solely through hashtags.
- Major brands doubled their Instagram Story use in 2021 compared to 2020.
- 4M+ businesses use Stories ads every month.
- 62% of Instagram users have grown more interested in a brand or product after seeing it in Stories.
- The median exit rate for Instagram Stories across all industries is 6%.
- 87% of brands prefer to use 7–30 hashtags in the caption for image posts. For video posts, however, businesses opt for 3–9 hashtags.
- 76% of businesses on Instagram believe images are the best type of content.
| What Kind of Content Americans Want to See from Brands on Instagram | Share |
|---|---|
| Fun or entertaining | 64% |
| Real or authentic | 61% |
| Creative | 60% |
| Personally relevant | 55% |
| Informative | 54% |
| Inspiring or uplifting | 49% |
| Beautifully produced | 38% |
- The top-performing industries on Instagram are fashion and beauty. They are followed by e-commerce (14%), auto (11%), retail (9%), electronics (5%), and sporting goods (4%).
- Nearly 56% of US marketers prefer to cooperate with micro-influencers because they are more cost-effective than macro-influencers or celebrities.

Looking for passport photos? Discover more information:
Instagram Ads
- In 2020, Instagram generated $17.4B in ad revenues in the US, and it’s expected to reach roughly $40B in 2023.
- Most Instagram ads (95%) are seen on mobile devices, leaving only 5% for desktops.
- Instagram ads are more expensive than Facebook ads (CPC: $1.09 vs. $0.49).
- YoY ad spending on Instagram has increased by 9%.
- Instagram places the main focus on ads in the feed—it has the highest CPC ($1.86) and CPM ($7.27).
- Instagram Story ad sets, on the other hand, have an average CPC of $0.66 and an average CPM of $3.49.
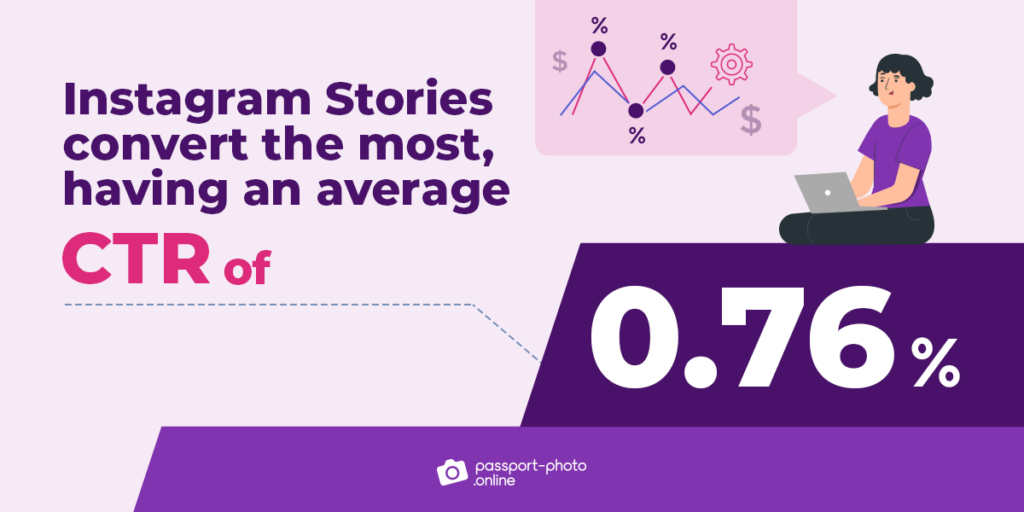
- Instagram Stories convert the most, having an average CTR of 0.76%.
- Instagram “Explore” ads have a CPC of $0.53 and a CPM of $2.71 on average.
- Picture ads are Instagram’s most popular type of sponsored ads.
- Centrally placed text for add-to-cart objectives gives a 75% chance of better performance.
- Campaigns that emphasize the CTA have an 89% better chance of outperforming those without the CTA emphasis.
- Dynamic ads with motion outperform static images most of the time for “view content,” “add to cart,” and “purchase” objectives.
FAQ
What was the first image ever shared on Instagram?
What’s the most liked Instagram post?
How many photos are posted on Instagram?
How many influences are there on Instagram?
How much is Instagram worth?
How much time do people spend on Instagram?
How many users does Instagram have?
What is the male-to-female ratio on Instagram?
How many people use Instagram Stories?
Which country posts the most on Instagram?
Is it better to post at night or in the morning on Instagram?
Does adding a location increase likes on Instagram?
Stacking It All Up
There you have it.
A comprehensive list of Instagram trends, facts, and stats for 2023 you can use to stay on top of things.
Let us know in the comments if there are any other IG figures you’d like to see.
Fair Use Statement
Did you like our infographics? If so, feel free to share them with your audience. Just remember to mention the source and link back to this page.
Sources
- BBC, “Facebook Buys Instagram Photo Sharing Network for $1bn”
- BBC, “The Dog That Launched a Social Media Giant”
- Bloomberg, “Instagram is estimated to be worth more than $100B”
- eMarketer, “How Much Are Brands Paying Influencers?”
- eMarketer, “Ads from Influencers You Don’t Follow: What Marketers Need To Know About Instagram’s New Update”
- Facebook, “How Instagram Boosts Brands and Drives Sales”
- Facebook, “How to Take Your Instagram Content to the Next Level”
- Facebook, “Second Quarter 2019 Results Conference Call”
- Facebook, “Instagram Shopping: Sell Your Products Online”
- Hootsuite, “Digital 2020: October Update”
- Instagram, “Instagram Stories”
- Instagram for Business
- Instagram, @creators
- Instagram, “How to Plan for Holidays on Instagram”
- Instagram, “2M Monthly Advertisers on Instagram”
- Instagram, “Welcome to IGTV, our New Video App”
- Internet Live Stats, Instagram
- Klear, “State of Influencer Marketing Report”
- Mention, “Instagram Engagement Report”
- Pew Research Center, “Social Media Fact Sheet”
- Pew Research Center, “7 Facts about Americans and Instagram”
- Socialbakers, “Must-Know Social Media Trends”
- Socialbakers, “Instagram and Facebook Trends Report”
- Socialinsider, “Instagram Stories: What Changed in the Story’s Performance in 2021? An Analysis of 962,402 Stories on Instagram”
- Socialinsider, “Facebook Ads vs. Instagram Ads: 137,228 Paid Social Posts Show What Kind of Social Media Ads Generate the Best Results”
- Socialinsider, “649,895 Brand Posts Show If It’s Better to Put Instagram Hashtags in the Post’s Caption or in the First Comment”
- Socialinsider, “We Looked at 7,433,417 Posts to Find Out the Recipe for the Most Engaging Instagram Post”
- Statista, “Instagram – Statistics & Facts”
- Siteefy, “167+ Internet Statistics, Trends and Facts [Mobile Included]”
- The Guardian, “Cristiano Ronaldo Shoots to Top of Instagram Rich List”
- TechCrunch, “Instagram Launches ‘Stories,’ a Snapchatty Feature for Imperfect Sharing”
- TechCrunch, “Instagram Stories launches TikTok clone Reels in Brazil”
- Vox, “People Spend Almost as Much Time on Instagram as They Do on Facebook”
- Wibbitz, “Explore Instagram Video: How to Convert, Engage, and Get More Instagram Followers with Video”

As a Digital PR specialist and a member of the Society of Professional Journalists (SPJ), Max has 5+ years of writing experience.
Over the course of his career, Max’s work has garnered significant attention, with features in numerous prominent publications such as The New York Times, Forbes, Inc., Business Insider, Fast Company, Entrepreneur, BBC, TechRepublic, Glassdoor, and G2.