Intrigued by the current landscape of chatbots?
You’ve come to the right place.
This is the ultimate collection of the most recent chatbot statistics, facts, and trends.
Top Chatbot Statistics (Editor’s Picks)
- The global chatbot market size was valued at $5.1B in 2022.
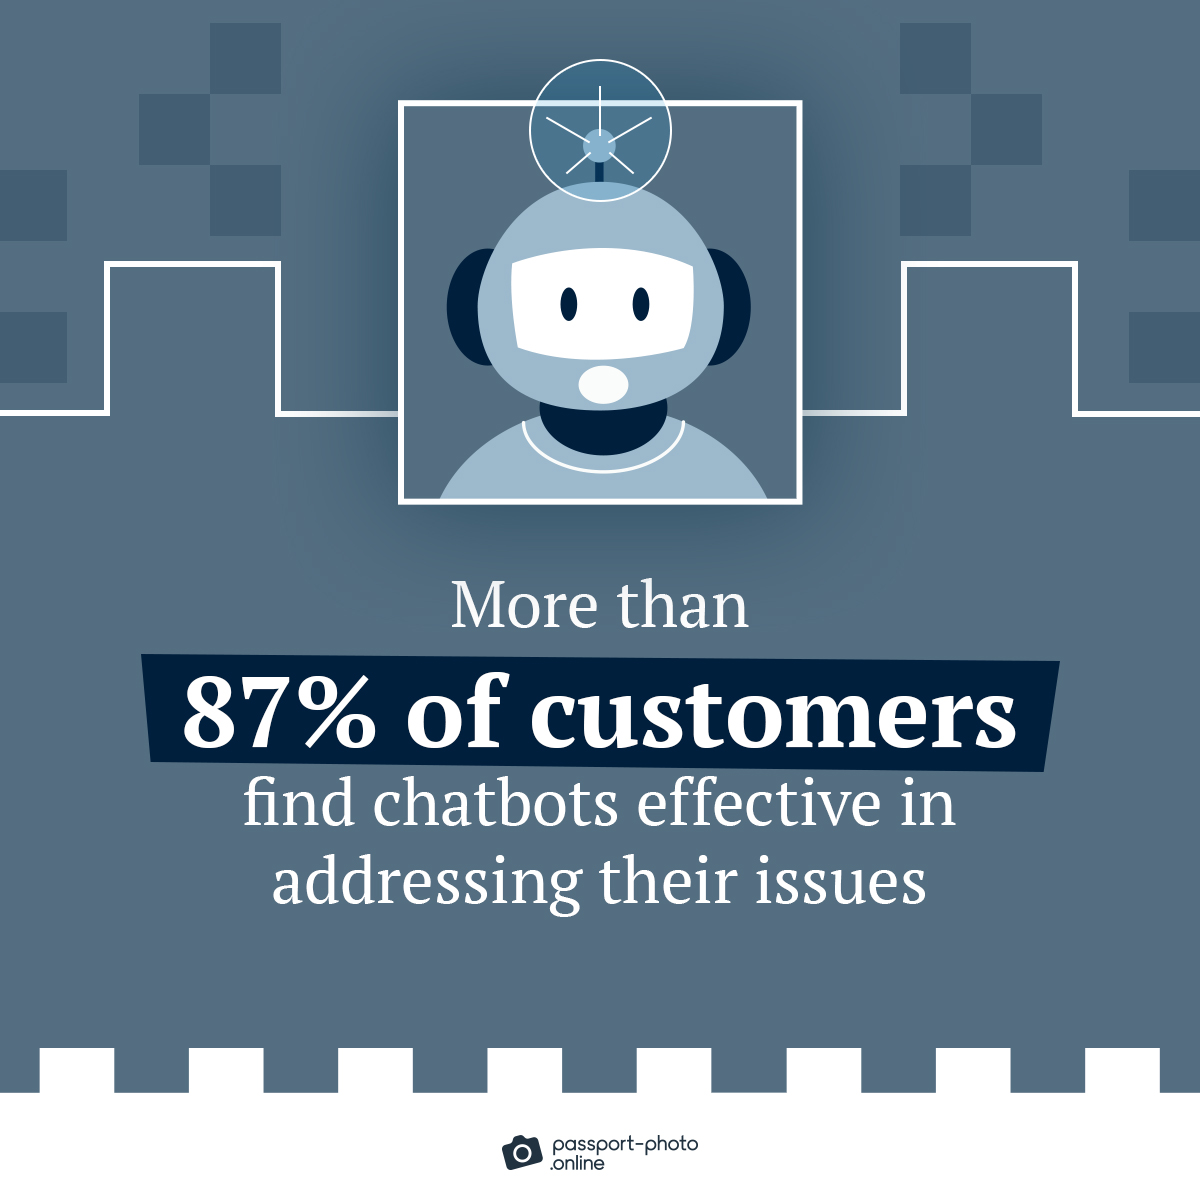
- More than 87% of customers find chatbots effective in addressing their issues.

- Over half of consumers (68%) like chatbots because they answer their questions quickly.
- When faced with waiting 15 minutes or more to speak with a human or engaging with a chatbot instantly, 62% of consumers would opt for the latter.
- Eight in 10 customers who’ve used chatbots say their experience was positive.
- A majority of customers (74%) prefer chatbots to get answers to simple questions.
- Over half of businesses (55%) using AI chatbots see an increase in high-quality leads.
- Using the Facebook Messenger Checkbox and an abandoned cart conversational commerce helps online stores grow revenue by 7–25%.
- Almost half of customers (43%) resolve banking issues via chatbots instead of visiting a branch.
- Most consumers (80%) have engaged with chatbots at least once in their lifetime.
General Chatbot Statistics, Facts, and Trends
- According to Exploding Topics, the term “chatbot” has grown 380% in the past five years.
- The global chatbot market size was valued at $5.1B in 2022.
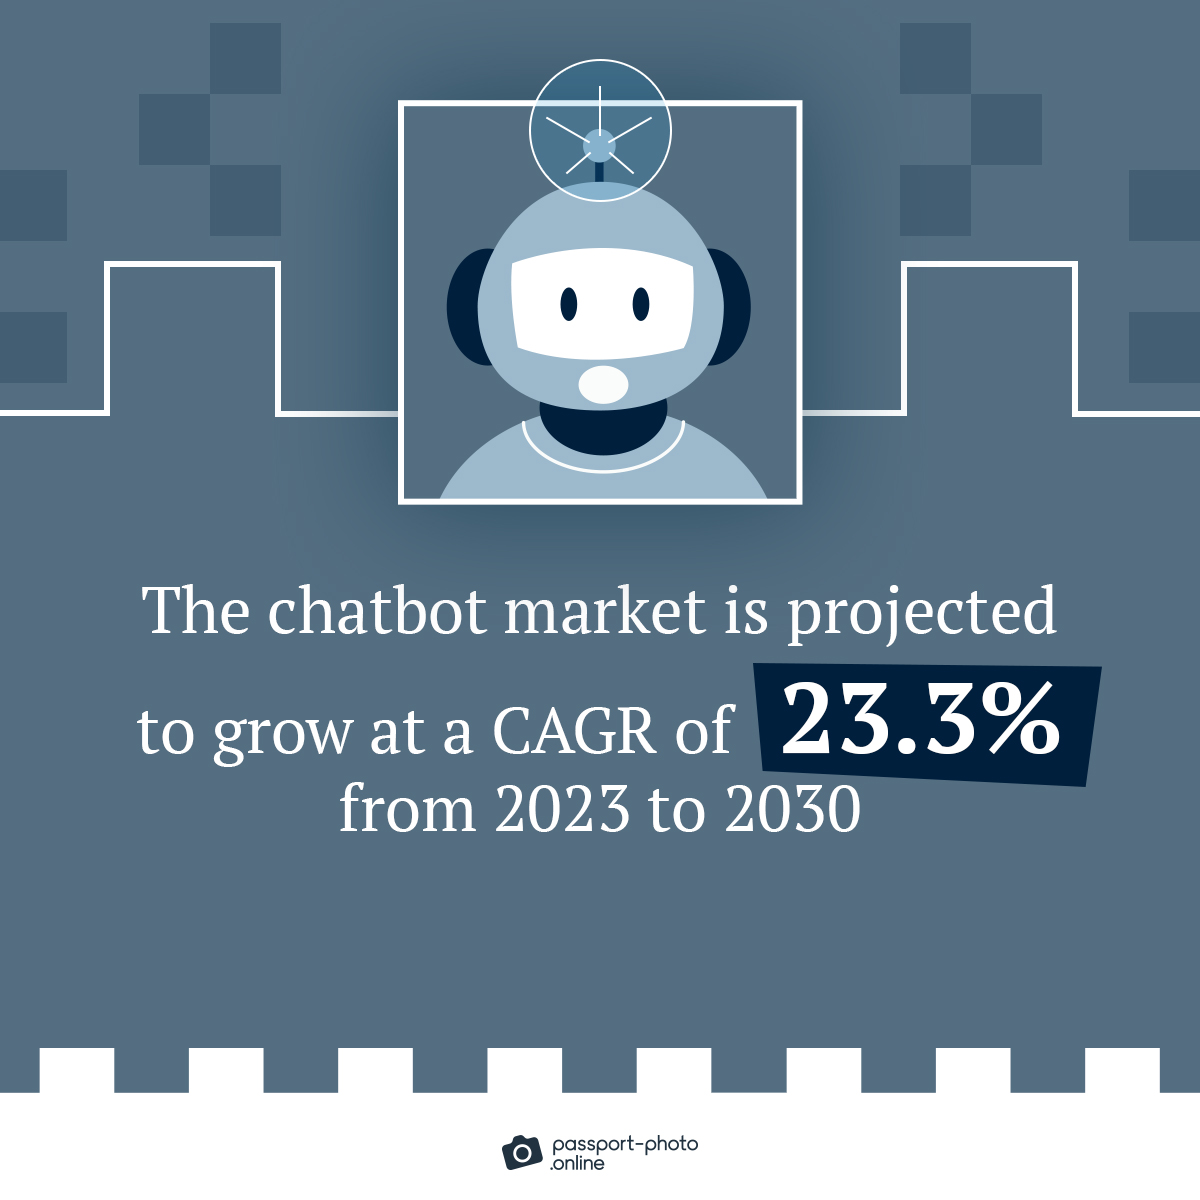
- The chatbot market is projected to grow at a CAGR of 23.3% from 2023 to 2030.

- With North America being a prominent chatbot industry hub, it holds the largest market share of ~30.72% as of 2022.
- By end user, the large enterprises segment accounted for most of the chatbot market share (~ 51%) in 2022.
- By application, the bot-for-service segment contributed over 36% of the total revenue share in 2022.
- By type, the standalone segment dominated the chatbot market in 2022, holding a market share of approximately 55.70%.
- By product, the marketing segment accounted for the largest market share of ~56% in the chatbot industry in 2022.
- By vertical, the e-commerce segment held the largest market share, accounting for around 21% of the chatbot industry in 2022.
| Chatbot Market Share, By Vertical (as of 2022) | Revenue Share |
|---|---|
| E-commerce | 21% |
| Healthcare | 19.5% |
| Media and Entertainment | 19.5% |
| Banking, Financial Services and Insurance (BFSI) | 15% |
| Travel & Tourism | 13.8% |
| Retail | 5.7% |
| Others | 5.5% |
- The global chatbot market is forecasted to reach a revenue of $454.8M in 2027, a significant increase from $40.9M in 2018.
| Chatbot Market Revenue Worldwide from 2020 to 2027 | In Million US Dollars |
|---|---|
| 2020 | 65.50 |
| 2021 | 83.40 |
| 2022 | 106.60 |
| 2023 | 137.60 |
| 2024 | 179.90 |
| 2025 | 239.20 |
| 2026 | 325.30 |
| 2027 | 454.80 |
- In 2023, the retail, banking, and healthcare sectors will achieve annual cost savings of $11B through chatbot adoption, a substantial increase from $6B in 2018.
- Companies can anticipate chatbots to save them approximately 2.5B hours of work by the end of 2023.
- Around 37% of chatbots are presented as female, nearly double that of male representations. The exact reason is unknown, but it’s probably because companies expect users to be more receptive to a female persona.
| Gender Distribution of AI Chatbots (as of 2022) | Share |
|---|---|
| Genderless | 40% |
| Female | 37% |
| Male | 20% |
- About 26% of B2B marketers who’ve used chatbots experienced a 10–20% boost in lead generation volumes.
- Roughly 87% of companies that don’t have chatbots plan to use them in the future, with 50% expected to do so within the next year or sooner.
- An average chatbot implementation yields a ~35–40% engagement rate.

Looking for passport photos? Discover more information:
What People Think of Chatbots
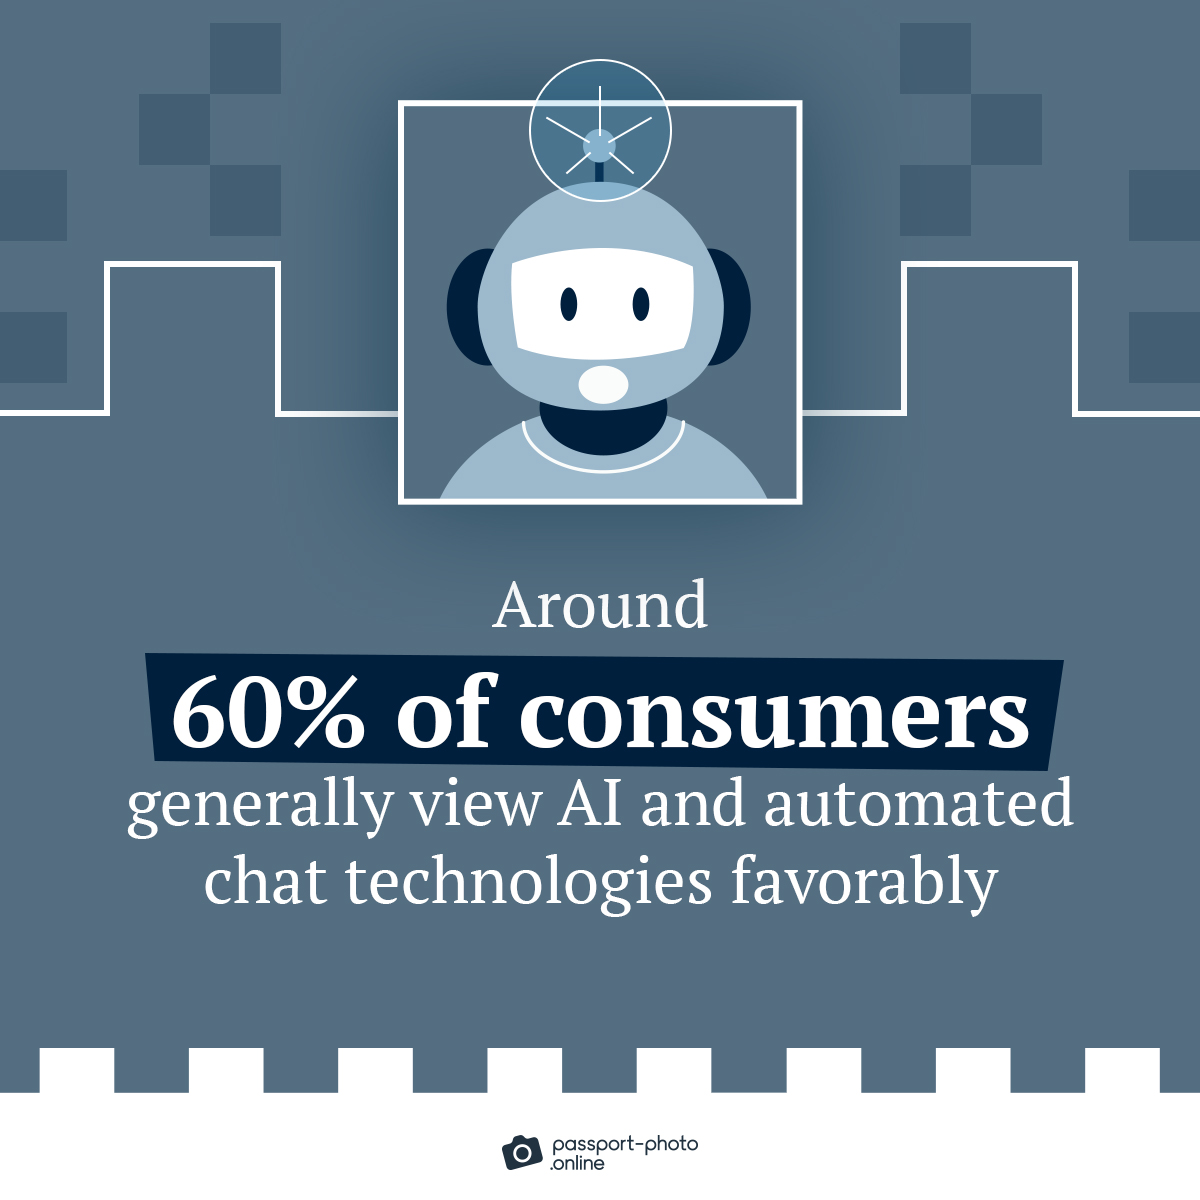
- Around 60% of consumers generally view AI and automated chat technologies favorably.

- Roughly 82% of consumers have engaged with a chatbot before. Of those, 70% said the chatbot answered all or most of their questions satisfactorily.
- Among customers who haven’t interacted with a chatbot, around 75% are aged 45 or above.
- A mere 9% of customers think companies should refrain from using chatbots.
- Nearly 40% of customers expressed interest in chatbot experiences from brands.
- When a company uses a chatbot on its site, 64% of people prefer seeking answers to basic questions from the chatbot than manually searching the site.
| Consumer Motivations for Using Chatbots | Share |
|---|---|
| Business Hours | 18% |
| Product Information | 17% |
| Customer Service Request | 16% |
| Nearby Locations | 16% |
| Requesting Technical Support | 12% |
| Requesting A Quote | 11% |
| Personalized Recommendations | 9% |
- About 60% of customers value the option to speak directly with a human agent without delay, even if it involves waiting. Still, over half are willing to interact with a chatbot initially and then be connected to a human.
- If a chatbot could deliver information faster than a live agent, 91% of respondents would use it.
- Most Gen Zers (56%) believe more companies should use chatbots.
| Customer Expectations of Chatbots | Share |
|---|---|
| Getting help 24/7 | 29% |
| Receiving a fast reply | 24% |
| Being able to reach a human agent if I want to | 17% |
| Using messages for asking questions in a natural way instead of using search | 11% |
| No need to talk with anyone | 11% |
| Receiving personalized messages | 8% |
- Most individuals (80%) who’ve engaged with a chatbot report a generally positive experience.
- About 38% of consumers believe brands should employ chatbots for deals, coupons, and promotions.
- Over half of consumers (55%) are willing to try a chatbot that offers location-based coupons, deals, or promotions from nearby brick-and-mortar retailers.
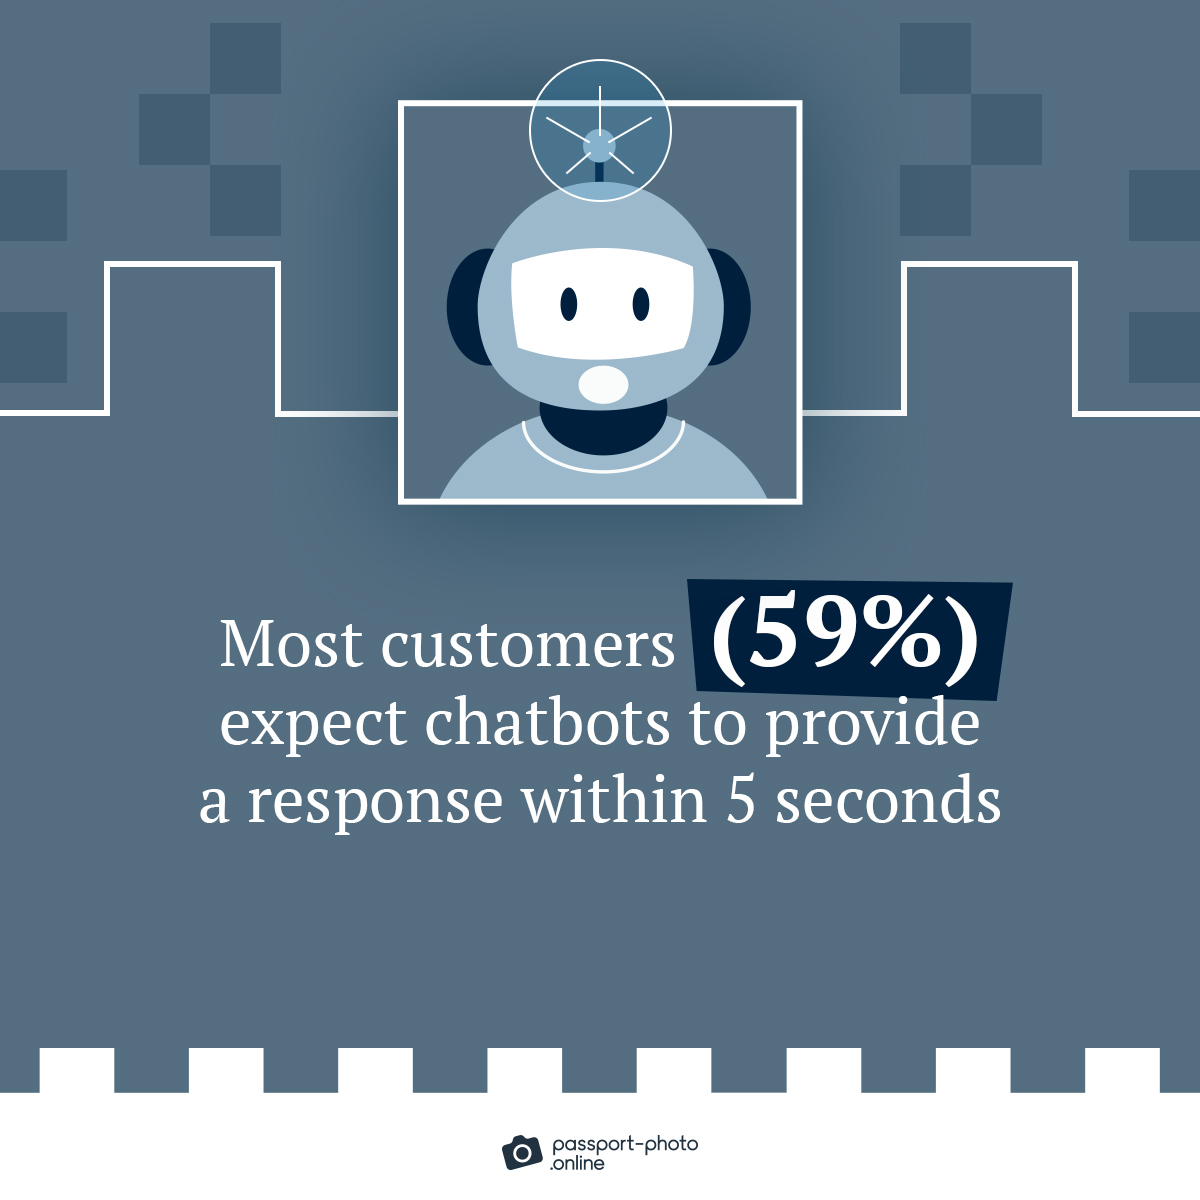
- A majority of customers (59%) expect chatbots to provide a response within five seconds.

- Over half of customers (54%) want chatbots to identify themselves as bots explicitly.
- Close to 45% of customers place significant importance on knowing whether they communicate with a live agent or chatbot.
- Around 36% of consumers believe chatbot accuracy needs to improve, particularly in understanding what people are asking or looking for (43%).
Stacking It All Up
There you have it.
A comprehensive list of chatbot statistics, facts, and trends.
Let us know in the comments if there are any other stats you’d like to see.
FAQ
What’s the chatbot market size?
Which region will lead the global chatbot market?
What’s the growth rate of chatbots?
How successful are chatbots?
Fair Use Statement
Did you like our infographics? If so, feel free to share them with your audience. Just remember to mention the source and link back to this page.
Sources
- Botco.ai, “The State of Chatbots in Marketing 2022”
- Chatbots Magazine, “The Complete Guide to Conversational Commerce”
- Drift, “2020 State of Conversational Marketing”
- Drift, “2021 State of Conversational Marketing”
- IBL News, “74% of Users Prefer AI Chatbots for Answers to Simple Questions”
- Insider Intelligence, “Digital Banking Users Are Turning to Chatbots”
- Juniper Research, “Chatbots to Deliver $11bn in Annual Cost Savings”
- Microsoft, “State of Global Customer Service Report”
- Precedence Research, “Chatbot Market Size To Hold USD 4.9 Billion By 2032”
- Statista, “Chatbot Market Revenue Worldwide from 2018 to 2027”
- Statista, “Consumer Satisfaction with Chatbot Customer Service in the United States as of June 2022”
- Statista, “Gender Representation in Artificial Intelligence (AI) Chatbots in 2022, by Gender”
- Statista, “Size of the Chatbot Market Worldwide from 2021 to 2030”
- Tidio, “The Future of Chatbots: 80+ Chatbot Statistics for 2023”
- Uberall, “Study: 80% of Consumers Report Chatbot Experiences as Positive Yet Nearly 60% Still Lack Strong Enthusiasm for the Technology”
- Userlike, “What Do Your Customers Actually Think About Chatbots?”

As a Digital PR specialist and a member of the Society of Professional Journalists (SPJ), Max has 5+ years of writing experience.
Over the course of his career, Max’s work has garnered significant attention, with features in numerous prominent publications such as The New York Times, Forbes, Inc., Business Insider, Fast Company, Entrepreneur, BBC, TechRepublic, Glassdoor, and G2.


