


Imagine this scenario:
You’re standing in front of a mountain vista, camera in hand. But instead of taking in the view, you’re fumbling with your phone to post the *perfect* shot on Instagram.
Minutes pass, and the moment is gone.
Sound familiar?
While tech gadgets can elevate a travel experience, they can also pull us away from it.
That’s why I’ve surveyed 1,031 Americans to uncover how they use tech while traveling—what they pack, how often they use it, and whether it’s a blessing or a distraction.
Let’s dive into the data.
Key Takeaways
- The smartphone is the most essential travel gadget (41%), followed by laptops (33%), tablets (8%) and headphones (6%).
- The majority (32%) use their devices for 3–4 hours daily when away from home.
- A little over half (50%) engage in work-related activities while traveling for leisure, with 28% doing so always and 22% frequently.
- The most common work tasks performed on the road are emails and communication (31%), project management (27%), and video conferencing (21%).
- Most (66%) feel pressure to respond to work-related communications during leisure travelers usually due to expectations from employers or managers (28%).
- The smartphone (40%) is the primary gadget contributing to the inability to fully disconnect from work while on trips.
The Smartphone Is the #1 Gadget for Most Travelers
To begin with, I wanted to uncover the go-to gadgets travelers bring along to understand usage patterns and preferences.
Let’s have a look at the findings:
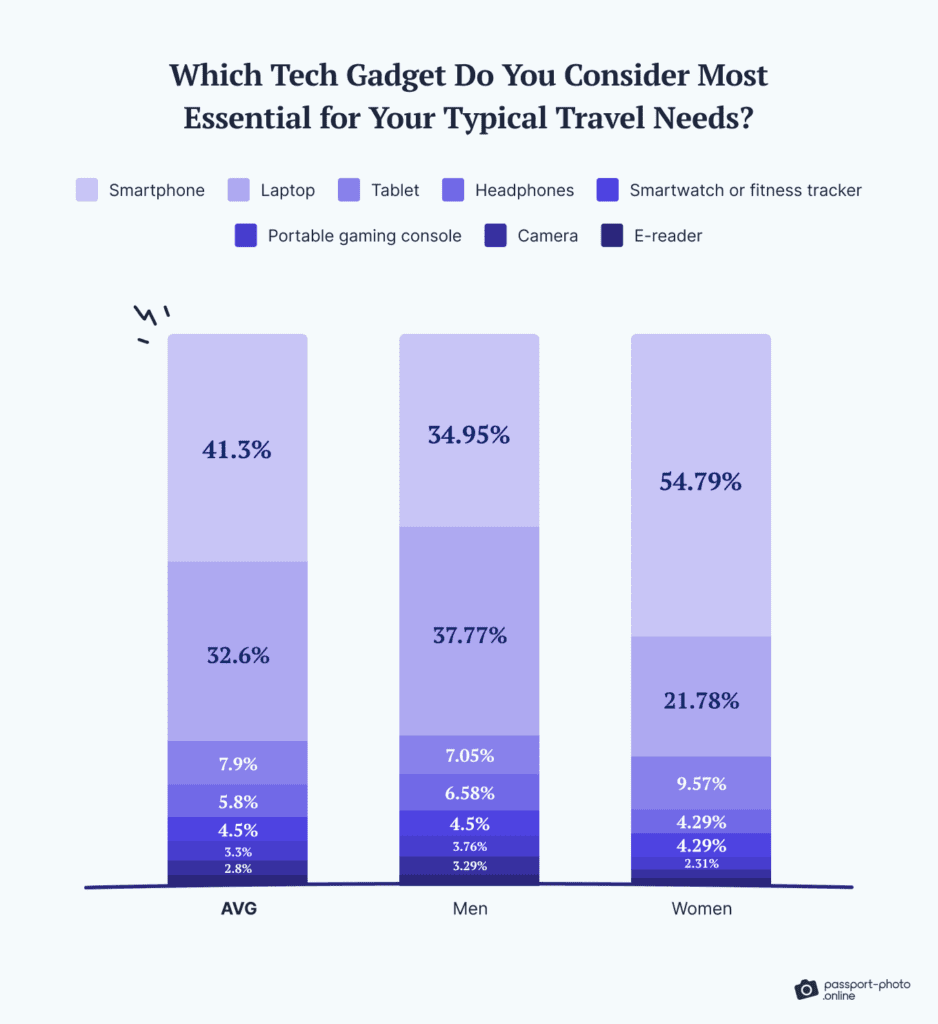
The smartphone dominates as the top choice, with 41.3% of respondents naming it their most essential gadget. The laptop follows at 32.6%.
Interestingly, smartphones are far more important for women than men (54.79% vs. 34.95%). On the other hand, men show a stronger preference for laptops (37.77% vs. 21.78%) and niche gadgets like gaming consoles (3.76% vs. 2.31%) and cameras (3.29% vs. 1.65%).
I also asked respondents how many gadgets they carry on trips, excluding small accessories such as chargers.
Below are the results:
| How Many Tech Gadgets Do You Typically Carry On a Trip? | In % |
|---|---|
| 3 | 24.3 |
| 2 | 22.5 |
| 4 | 19.6 |
| 5 | 16.3 |
| 1 | 10.3 |
| 6 or more | 6.8 |
| 0 | 0.2 |
As you can see, most stick to the practical range of 2–4 gadgets (66.4%).
Now—
In the next segment, I’ll dive into how often these devices are used, their primary purposes, and how preferences differ by demographics.
Americans Usually Spend 3–4 Hours a Day on Devices
Back in the 2000s, traveling with tech was… well, a challenge.
Chunky Nokia phones could manage a game of Snake, and laptops were powerful enough to crash after opening a few browser tabs.
Today, our devices can do so much more, especially since the advent of large language models like ChatGPT.
So—
What are their primary uses during trips?
Let’s find out:
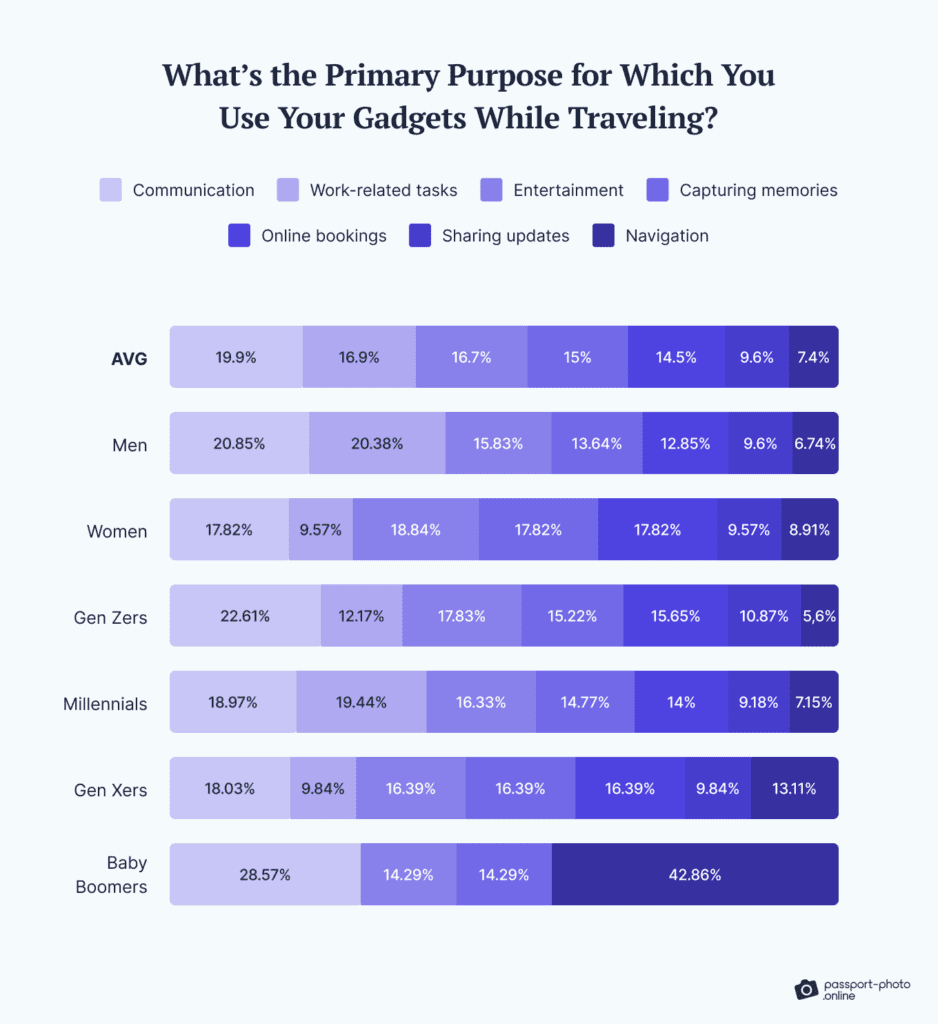
The data reveals that communication tops the list (19.9%), followed by work (16.9%), entertainment (16.7%), and capturing memories (15%).
Usage patterns also vary by gender and generation.
Men prioritize communication (20.85%) and work (20.38%), while women focus on entertainment (18.84%), capturing memories, and online bookings (17.82%).
Generationally, Gen Zers (22.61%) favor messaging, Millennials (19.44%) focus on work-related tasks, Gen Xers (18.03%) value communication, and Baby Boomers (42.86%) rely heavily on navigation.
Respondents also shared how much time they spend on devices.
Take a look:
| On Average, How Many Hours per Day Do You Actively Use Tech Gadgets While Traveling? | In % |
|---|---|
| 3–4 hours | 32 |
| 1–2 hours | 26.9 |
| 5–6 hours | 23.2 |
| More than 6 hours | 10 |
| Less than 1 hour | 5.5 |
| It’s hard to say | 2.4 |
The takeaway?
Most (32%) use their devices for 3–4 hours daily. Minimalists and heavy users—those using tech for less than an hour or more than six hours—account for 15.5% of respondents.
So, where do you fall on the spectrum—minimalist, balanced, or heavy user?
A Little over Half Say Gadgets Enhance Travel, but Not Everyone Agrees
At this stage, I also wanted to explore whether gadgets enhance or detract from the travel experience.
Here’s what respondents shared:
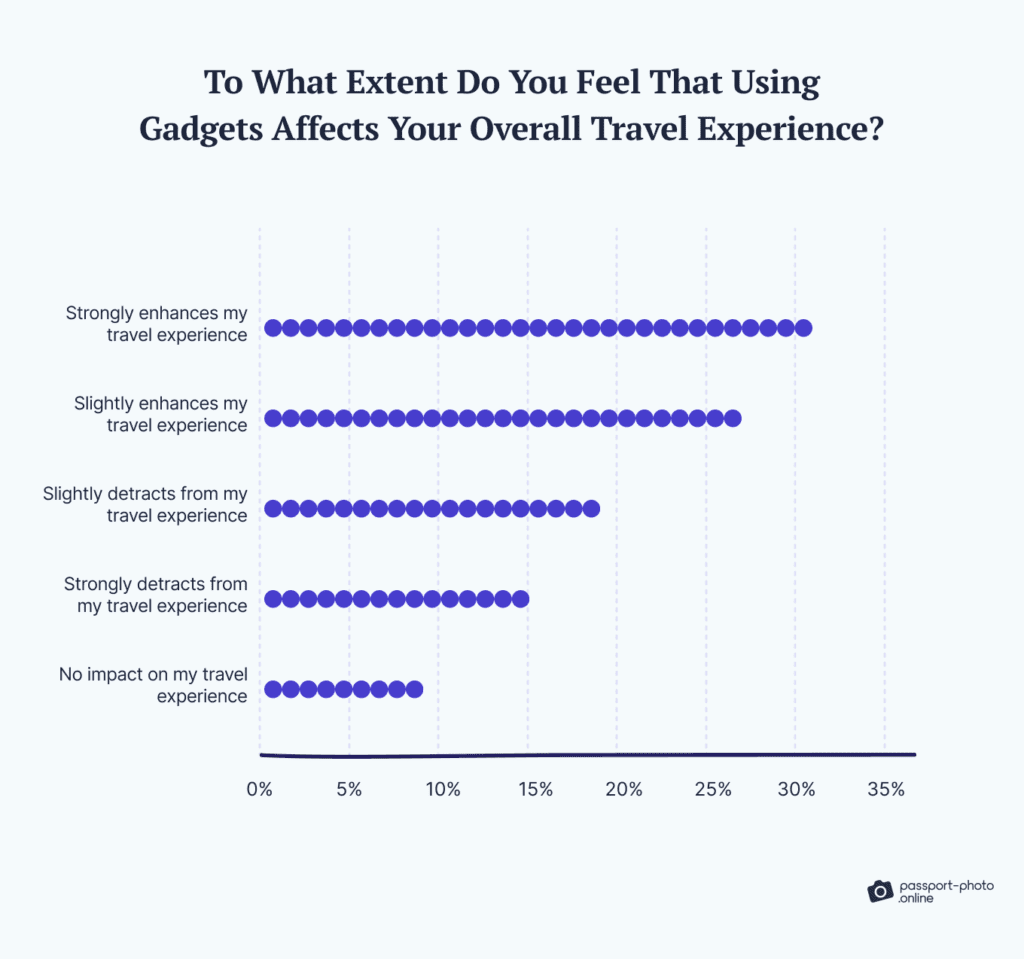
The majority (57.4%) believe gadgets enhance their travels. Of those, 30.7% feel they “strongly enhance” the experience, while 26.7% say they “slightly enhance” it.
However, 34.1% think gadgets are more of a drawback.
When asked why, the top concerns included excessive gadget use (24.4%), over-documenting moments (20.2%), and stress from constant connectivity (17.7%) as shown below.
| What Is the Main Reason You Feel Using Gadgets Detracts from Your Overall Travel Experience? | In % |
|---|---|
| I spend too much time on my gadgets and miss out on experiencing my surroundings. | 24.4 |
| I focus too much on documenting my trip (e.g., taking photos or videos) instead of enjoying the moment. | 20.2 |
| I feel pressured to stay connected with work or social media, which adds stress during travel. | 17.7 |
| Using gadgets makes me less spontaneous and overly reliant on technology for planning and navigation. | 16.6 |
| Using gadgets reduces opportunities to interact with locals or travel companions. | 13.8 |
| Notifications and frequent usage interrupt my ability to relax and unwind. | 7.3 |
It’s clear that while gadgets can enhance travel, they also come with trade-offs.
Thus, striking the right balance between enjoying the moment and leveraging technology could be the ultimate travel hack.
After all, the best memories are made when you’re fully present.
Nearly 4 in 10 Travelers Struggle to Disconnect Because of Smartphones
Last but not least, I wanted to explore how Americans use gadgets for work.
Let’s look at the results:
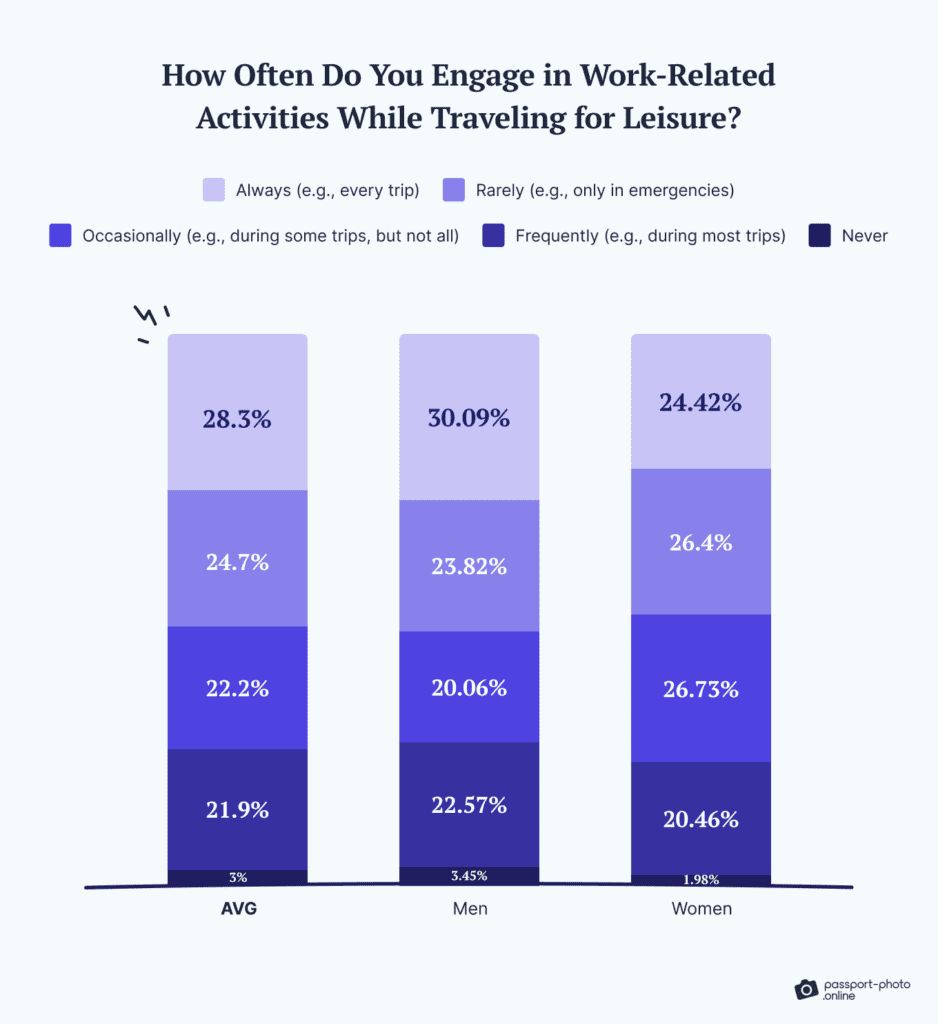
A little over half (50.2%) engage in work-related activities during leisure trips, with 28.3% doing so always and 21.9% frequently. Gender-specific data also shows men are more likely than women to always work during trips (30.09% vs. 24.42%).
Which gadgets do we primarily use for work?
Laptops (44.2%) and smartphones (33.7%) dominate, accounting for 77.9%.
Take a look:
| Which Gadget Do You Primarily Use for Work-Related Tasks While Traveling for Leisure? | In % |
|---|---|
| Laptop | 44.2 |
| Smartphone | 33.7 |
| Smartwatch | 10.7 |
| Tablet | 9.9 |
Seeing smartwatches rank so highly at 10.7% was surprising.
One plausible explanation could be their convenience for quick, on-the-go interactions. Smartwatches let you glance at emails, manage notifications, and even respond to messages without pulling out a phone.
Building on this, I wanted to determine which work tasks survey takers perform most often.
Let’s look at the results:
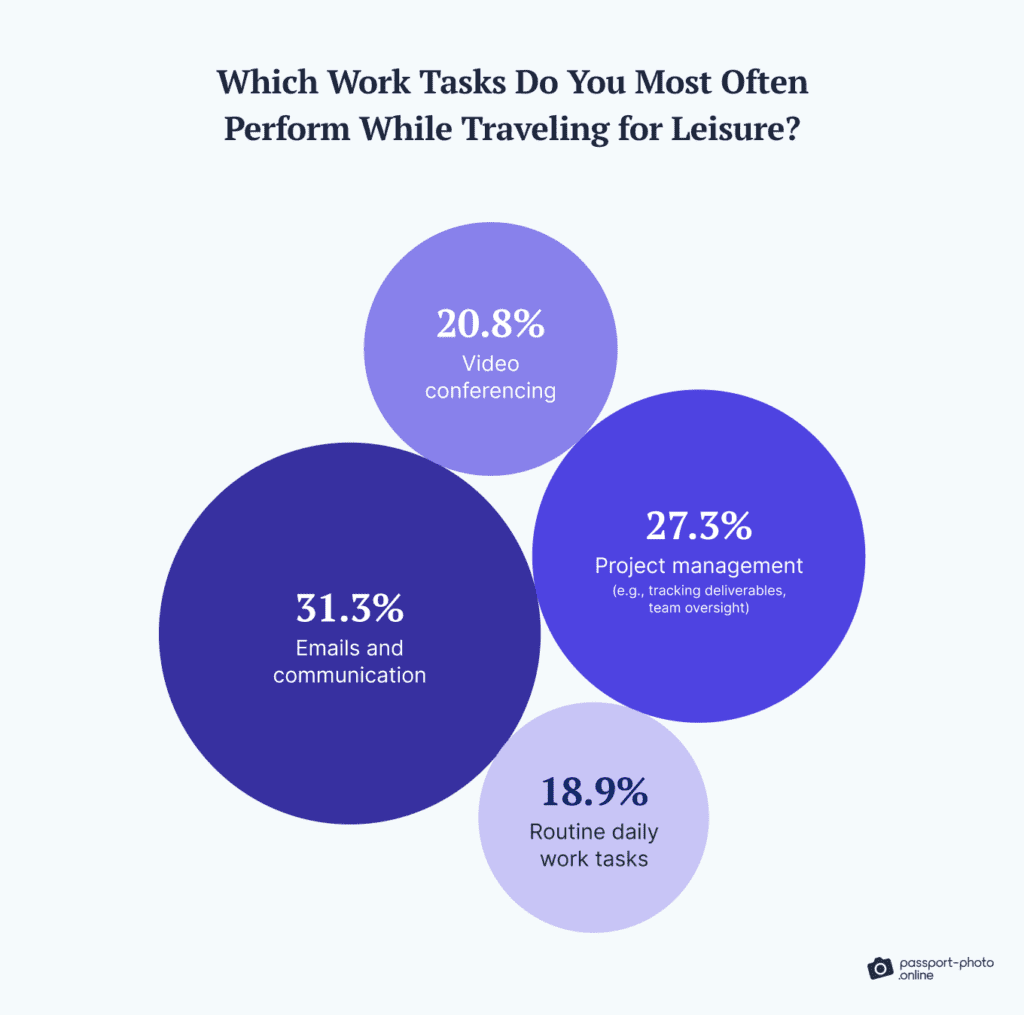
Exchanging emails and messages as well as video conferencing are the top priorities, making up 52.1%. Project management (e.g., tracking deliverables, team oversight) comes in second at 27.3%.
With this, I also asked how much pressure respondents feel to respond to work-related communications when on the road:
| How Much Pressure Do You Feel to Respond to Work-Related Communications on Your Gadget(s) While Traveling for Leisure? | In % |
|---|---|
| Sometimes feel pressured | 30.3 |
| Rarely feel pressured | 23.8 |
| Always feel strongly pressured | 18 |
| Often feel pressured | 17.6 |
| Not at all pressured | 10.3 |
Most respondents (65.9%) report feeling some degree of pressure, with 30.3% feeling pressured sometimes, 18% always, and 17.6% often.
What’s driving this stress?
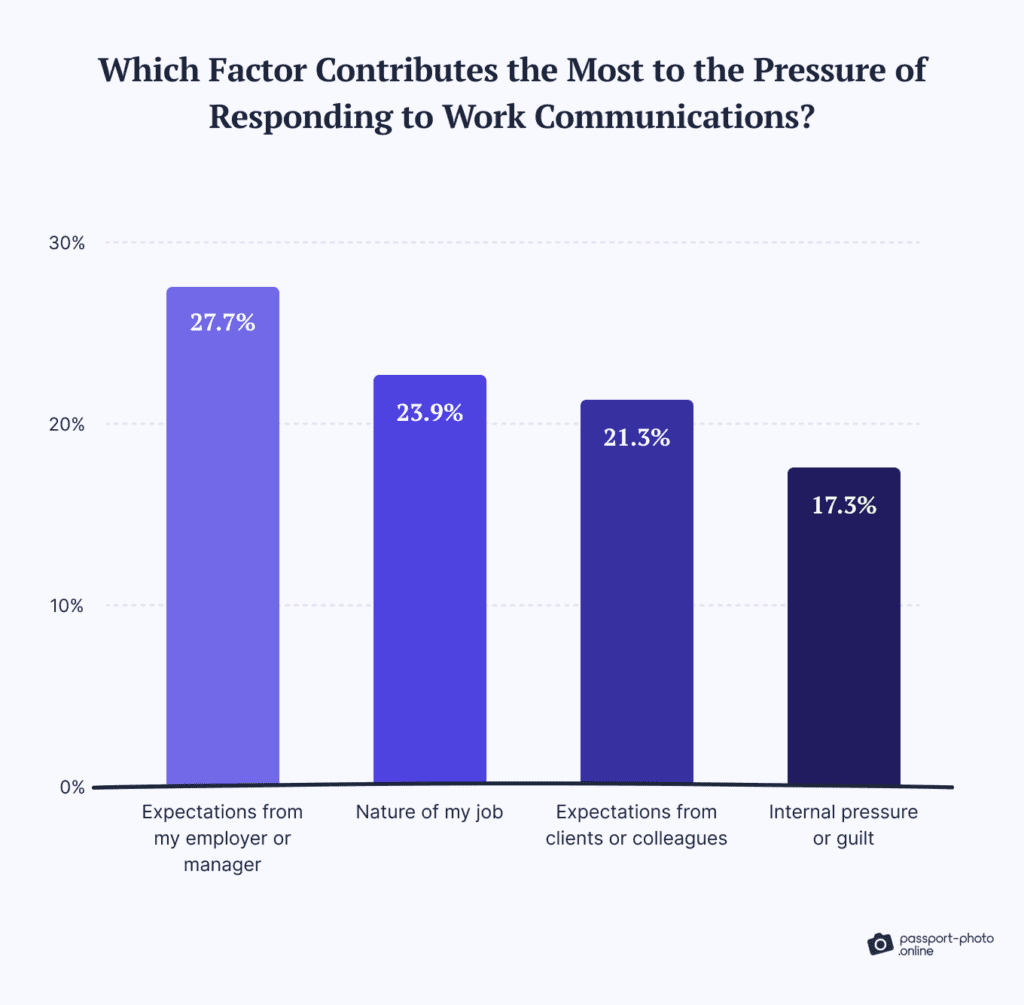
It turns out it’s external factors such as employers, job nature, and clients/colleagues at 72.9%. Internal factors, including guilt or self-imposed obligations, make up just 17.3%.
Finally, I asked which gadget contributes most to survey participants’ inability to disconnect from work.
| Which Gadget Contributes Most to Your Inability to Fully Disconnect from Work While Traveling for Leisure? | In % |
|---|---|
| Smartphone | 40.4 |
| Laptop | 35.1 |
| Tablet | 9.4 |
| Portable gaming console | 7.2 |
| Smartwatch or fitness tracker | 6.8 |
| Not applicable | 1.2 |
Smartphones take the lead, cited by 40.4% of respondents.
Perhaps those old Nokia phones weren’t so bad after all—or were they?
Wrapping It All Up
There you have it.
A comprehensive look at Americans’ experiences using tech gadgets while traveling for leisure.
Now—
If you believe your audience will be interested in this information, feel free to share it. Just remember to mention the source and link back to this page.
Methodology
I conducted an online survey of 1,031 US respondents via a bespoke online polling tool in December 2024.
The respondents identified as 67.7% male and 32.3% as female. 23.3% of respondents were 27 or younger, 69.4% were 28–43, 6.7% were 44–59, and 0.7% were 60 or older.
This survey has a confidence level of 95% and a margin of error of 3%. Given the gender and age makeup of our sample size, the study’s findings are statistically significant for the population at large.
This study was created through multiple research steps, crowdsourcing, and surveying. Data scientists reviewed all survey participants’ responses for quality control. The survey also had an attention-check question.

As a Digital PR specialist and a member of the Society of Professional Journalists (SPJ), Max has 5+ years of writing experience.
Over the course of his career, Max’s work has garnered significant attention, with features in numerous prominent publications such as The New York Times, Forbes, Inc., Business Insider, Fast Company, Entrepreneur, BBC, TechRepublic, Glassdoor, and G2.