Intrigued by the pulse of the gig economy in 2023?
Your search ends here.
We’ve compiled an exhaustive collection of 26+ gig economy statistics, facts, and trends for 2023.
Let’s jump right in:
Top Gig Economy Statistics (Editor’s Picks)
- As of 2023, the global gig economy workforce reached 78M, a significant increase from 2018’s 43M.
- There are 73.3M freelancers in the US. By 2027, the number will rise to 86.5M, comprising 50.9% of the workforce.
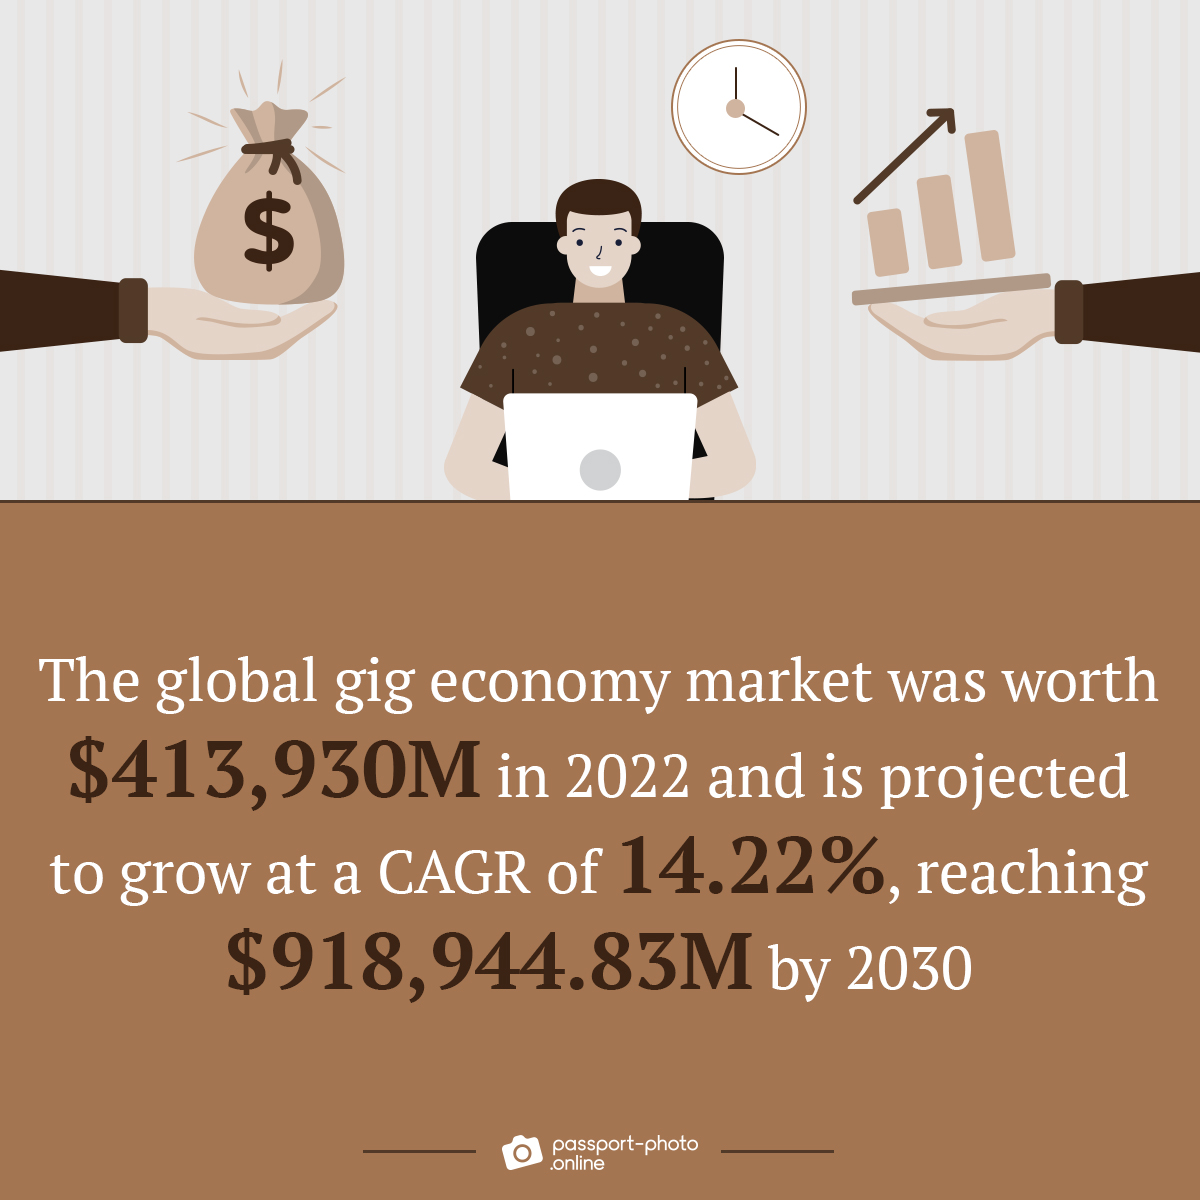
- The global gig economy market was worth $413,930M in 2022 and is projected to grow at a CAGR of 14.22%, reaching $918,944.83M by 2030.

- About 36% (or 59M individuals) of the US workforce participates in the gig economy.
- Women in the gig economy earn 48% less than their male counterparts.
- The gig economy comprises 34% of the Millennial population as of 2022.
- Gig workers in the US area earn an estimated total pay of $49,599 per year, with an average salary of $38,195.

Looking for passport photos? Discover more information:
General Gig Economy Stats, Facts, and Trends
- Nearly 16% of Americans have made money via online gig platforms.
- The US has 59M independent workers, accounting for 36% of the workforce.
| Breakdown of Freelance Workforce in the US (2022) | In Millions |
|---|---|
| Gig and contract, freelance and temporary workers | 26 |
| Contract, freelance, and temporary only | 29 |
| Gig only | 14 |
| Unemployed | 6 |
| Permanent workers | 100 |
- As of 2023, there’s a total of 73.3M freelancers in the US.
| Freelancer Count in the US from 2019 to 2028 | In Millions |
|---|---|
| 2019 | 62.20 |
| 2020 | 64.80 |
| 2021 | 67.60 |
| 2022 | 70.40 |
| 2023 | 73.30 |
| 2024 | 76.40 |
| 2025 | 79.60 |
| 2026 | 83 |
| 2027 | 86.50 |
| 2028 | 90.10 |
- The gender distribution in the independent workforce is 50% female and 49% male.
- In 2022, there were approximately 31.9M occasional independent workers, up from 15.8M in 2020.
| Number of Individuals Working Independently in the US, Categorized by Frequency, 2017–2021 | Occasional Independent Workers | Part-Time Independent Workers | Full-Time Independent Workers |
|---|---|---|---|
| 2017 | 12.90 | 11.80 | 16.20 |
| 2018 | 14.10 | 11.10 | 15.80 |
| 2019 | 15 | 10.80 | 15.30 |
| 2020 | 15.80 | 8.80 | 13.60 |
| 2021 | 23.90 | 10.20 | 17 |
| 2022 | 31.90 | 11.10 | 21.60 |
- The gig economy comprises 34% of Millennials as of 2022.
| Demographics of Independent Workers | Share |
|---|---|
| Baby Boomers | 23% |
| Gen Zers | 15% |
| Millennials | 34% |
| Gen Xers | 28% |
- Male freelancers earn an average of $22.28 more than their female counterparts.
| Gender Pay Gap among Freelance Workers in the US, by Selected Roles (2022) | Men’s Average Hourly Rate | Women’s Average Hourly Rate |
|---|---|---|
| Marketing Strategy | 118.20 | 91.05 |
| Financial Analysis and Modeling | 96.35 | 90.13 |
| Data Visualization | 94.09 | 88.75 |
| Business Writing | 91.33 | 67.72 |
| Sales and Business Development | 86.04 | 66.99 |
| HR Administration | 61.83 | 65.09 |
| Market Research | 75.54 | 62.67 |
| Agile Leadership | 83.41 | 62.50 |
| Back-End Development | 77.42 | 61.67 |
| Copywriting | 55.03 | 61.32 |
| Front-End Development | 64.93 | 55.90 |
| Graphic Design | 53.51 | 54.09 |
| Social Media Strategy | 50 | 53.39 |
| Systems Administration | 99.74 | 51.67 |
| Search Engine Optimization (SEO) | 75.89 | 50.15 |
| Ecommerce Website Development | 77.95 | 48.75 |
| Accounting | 64.79 | 44.20 |
| 3D Modeling and Rendering | 46.43 | 42.93 |
| DevOps Engineering | 100.90 | 30 |
| Data Entry | 23.58 | 20.58 |
- The share of independent workers who find work on talent platforms rose to 41% in 2022, up from 15% in 2015 and a mere 3% in 2012.
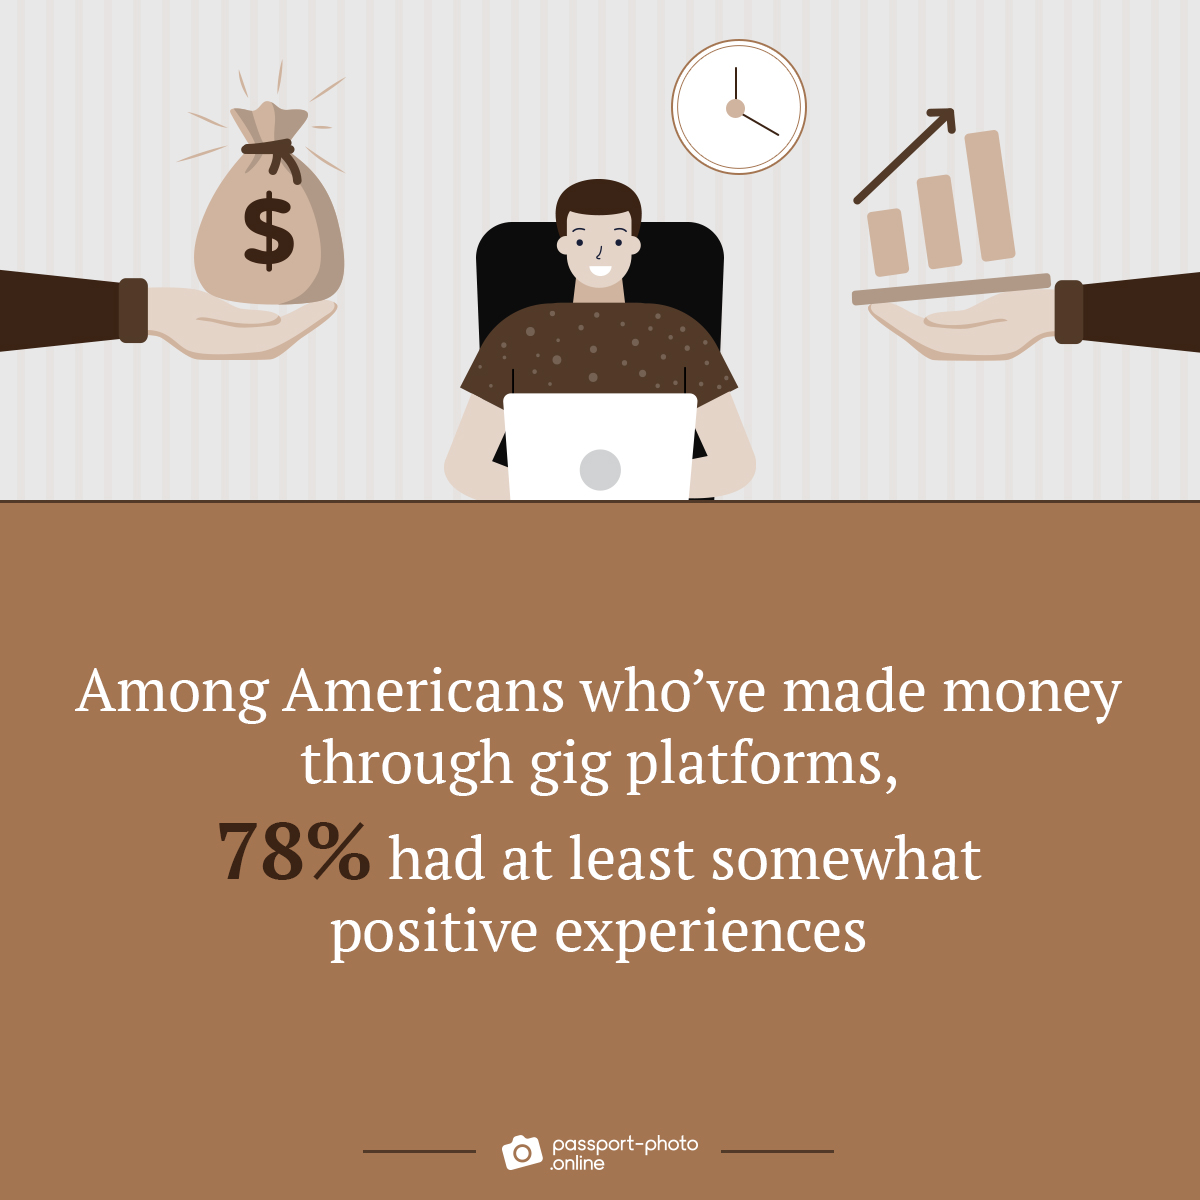
- Among Americans who’ve made money through gig platforms, 78% had at least somewhat positive experiences, including 24% who describe it as very positive.

- In 2022, 36% of independent workers secured employment through social media, a notable increase from 17% in 2015.
- The percentage of full-time high-earning independent workers in the US who make $100,000 or more rose to 20.37% in 2022, compared to 12.5% in 2011.
| Percentage of High-Earning Full-Time Independent Workers in the US, 2011–2022 | Share |
|---|---|
| 2011 | 12.50% |
| 2012 | 13.10% |
| 2013 | 14.30% |
| 2014 | 15% |
| 2015 | 16% |
| 2016 | 17.90% |
| 2017 | 19.80% |
| 2018 | 20.90% |
| 2019 | 20% |
| 2020 | 22.10% |
| 2021 | 22.35% |
| 2022 | 20.37% |
- Young adults (aged 18 to 29) are the most inclined to earn money through online gig platforms.
| Age Distribution of US Gig Platform Workers (2021) | Currently Earning Money | Not Currently, but in the Past 12 Months | More than 12 Months Ago |
|---|---|---|---|
| 18–29 | 9% | 13% | 9% |
| 30–49 | 4% | 6% | 8% |
| 50–64 | 3% | 4% | 6% |
| 65+ | 1% | 1% | 4% |
- Most freelancers in the United States (45%) are compensated through fixed fees instead of an hourly rate (32%).
- Most gig workers in the US (54%) work 11 to 30 hours weekly.
| Weekly Hours Worked by US Gig Economy Workers | Share |
|---|---|
| 10 or fewer | 4% |
| 11–20 | 27% |
| 21–30 | 27% |
| 31–40 | 18% |
| 41–50 | 16% |
| 51–60 | 4% |
| 61 + | 3% |
- Around 75% of independent workers believe social media plays a significant role in building a reputation, with 34% considering it very important and 41% seeing it as somewhat important.
- The primary reason for engaging in contract, freelance, or temporary work is to support basic family needs.
| Primary Motivations for Contract, Freelance, or Temporary Work in the US (2022) | Share |
|---|---|
| Out of necessity to support essential family needs | 25.70% |
| For the autonomy and flexibility it offers | 24.90% |
| Enjoy the work | 24.70% |
| Additional discretionary income | 19.50% |
- Roughly 76% of independents report being highly satisfied with their work.
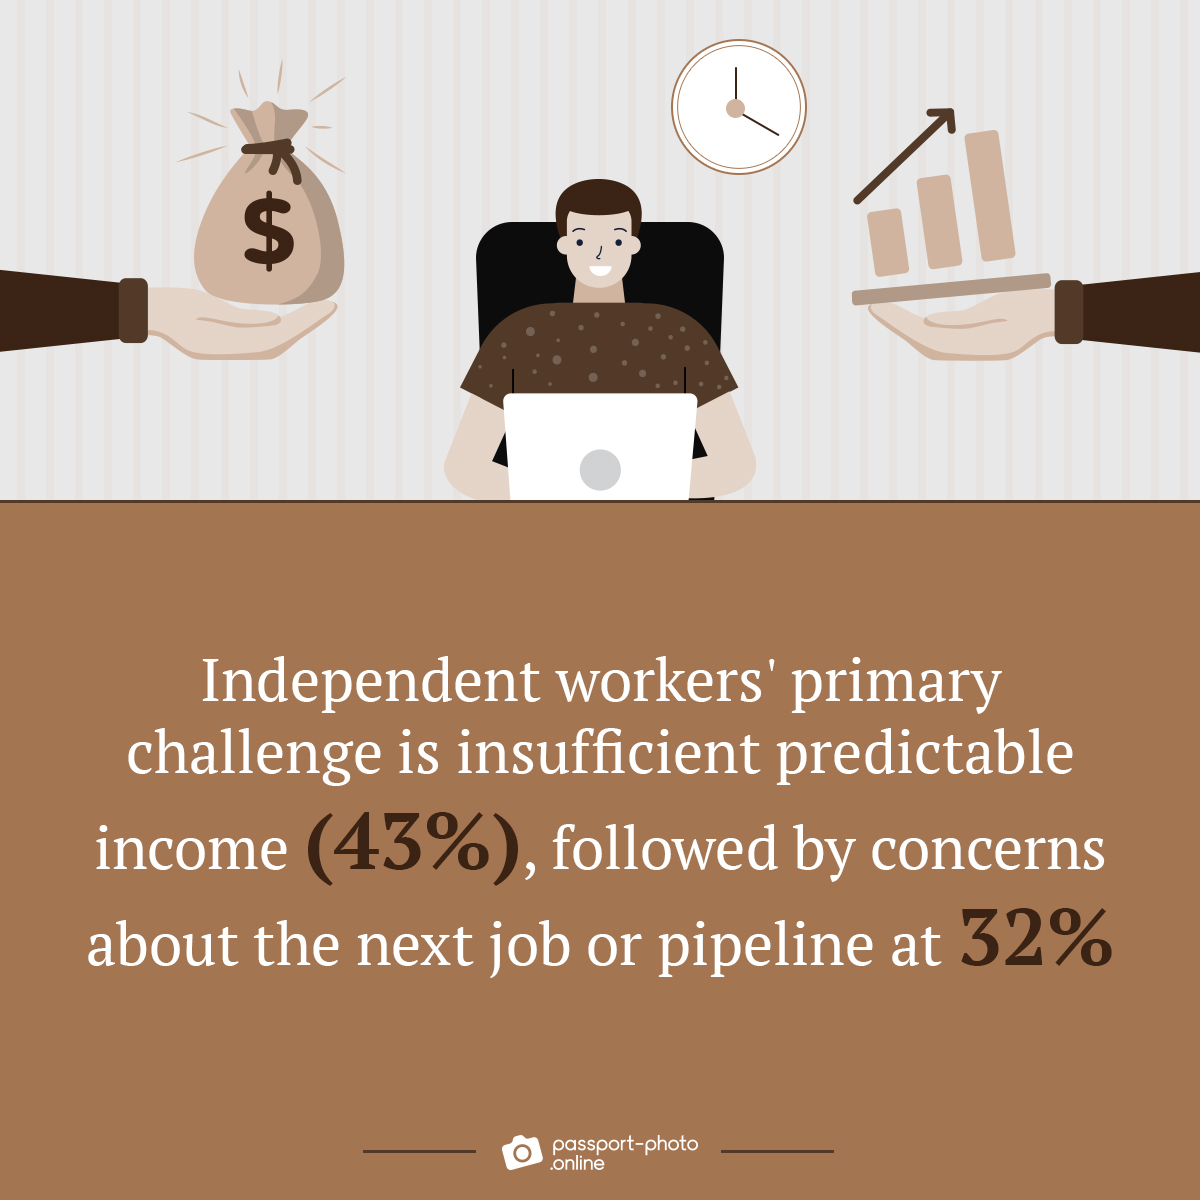
- Independent workers’ primary challenge is insufficient predictable income (43%), followed by concerns about the next job or pipeline at 32%.

- Among women who’ve earned money via gig platform apps, 22% have experienced unwanted sexual advances.
- Of Americans who earned money through online gig platforms, 72% found the job assignment process fair. However, only 46% felt that online gig platforms’ benefits were fair.
| US Gig Workers’ Perception of Fairness in Pay, Assignments, and Benefits on Gig Platforms (2021) | Fair | Unfair |
|---|---|---|
| How jobs are assigned | 72% | 25% |
| Pay | 64% | 34% |
| Benefits | 50% | 46% |
- In 2022, 54% of independent workers intended to continue working independently, while merely 12% planned to pursue a full-time job.
Stacking It All Up
There you have it.
A comprehensive list of gig economy statistics, facts, and trends.
Let us know in the comments if there are any other stats you’d like to see.
FAQ
How big is the gig economy?
What percentage of Americans are in the gig economy?
What percentage of Millennials make up the gig economy?
How much do gig workers make?
Fair Use Statement
Did you like our infographics? If so, feel free to share them with your audience. Just remember to mention the source and link back to this page.
Sources
- Bloomberg, “Men Make 48% More Than Women in the Gig Economy, Study Finds”
- Glassdoor, “Salary: Gig Worker”
- HRO Today, “The Rise of Gig Work in 2023”
- MarketWatch, “Global “Gig Economy Market” Highlights 2023–2030: Best Growth Survey”
- Mastercard, “Fueling the Global Gig Economy”
- MBO Partners, “State of Independence in America 2022”
- McKinsey, “Freelance Work, Side Hustles, and the Gig Economy”
- Pew Research, “The State of Gig Work in 2021”
- Statista, “Gig economy in the US”

As a Digital PR specialist and a member of the Society of Professional Journalists (SPJ), Max has 5+ years of writing experience.
Over the course of his career, Max’s work has garnered significant attention, with features in numerous prominent publications such as The New York Times, Forbes, Inc., Business Insider, Fast Company, Entrepreneur, BBC, TechRepublic, Glassdoor, and G2.


