Hungry for the latest intel on SaaS in 2025?
We’ve gathered, vetted, and organized a list of the latest SaaS data for your convenience.
Top SaaS Statistics (Editor’s Picks)
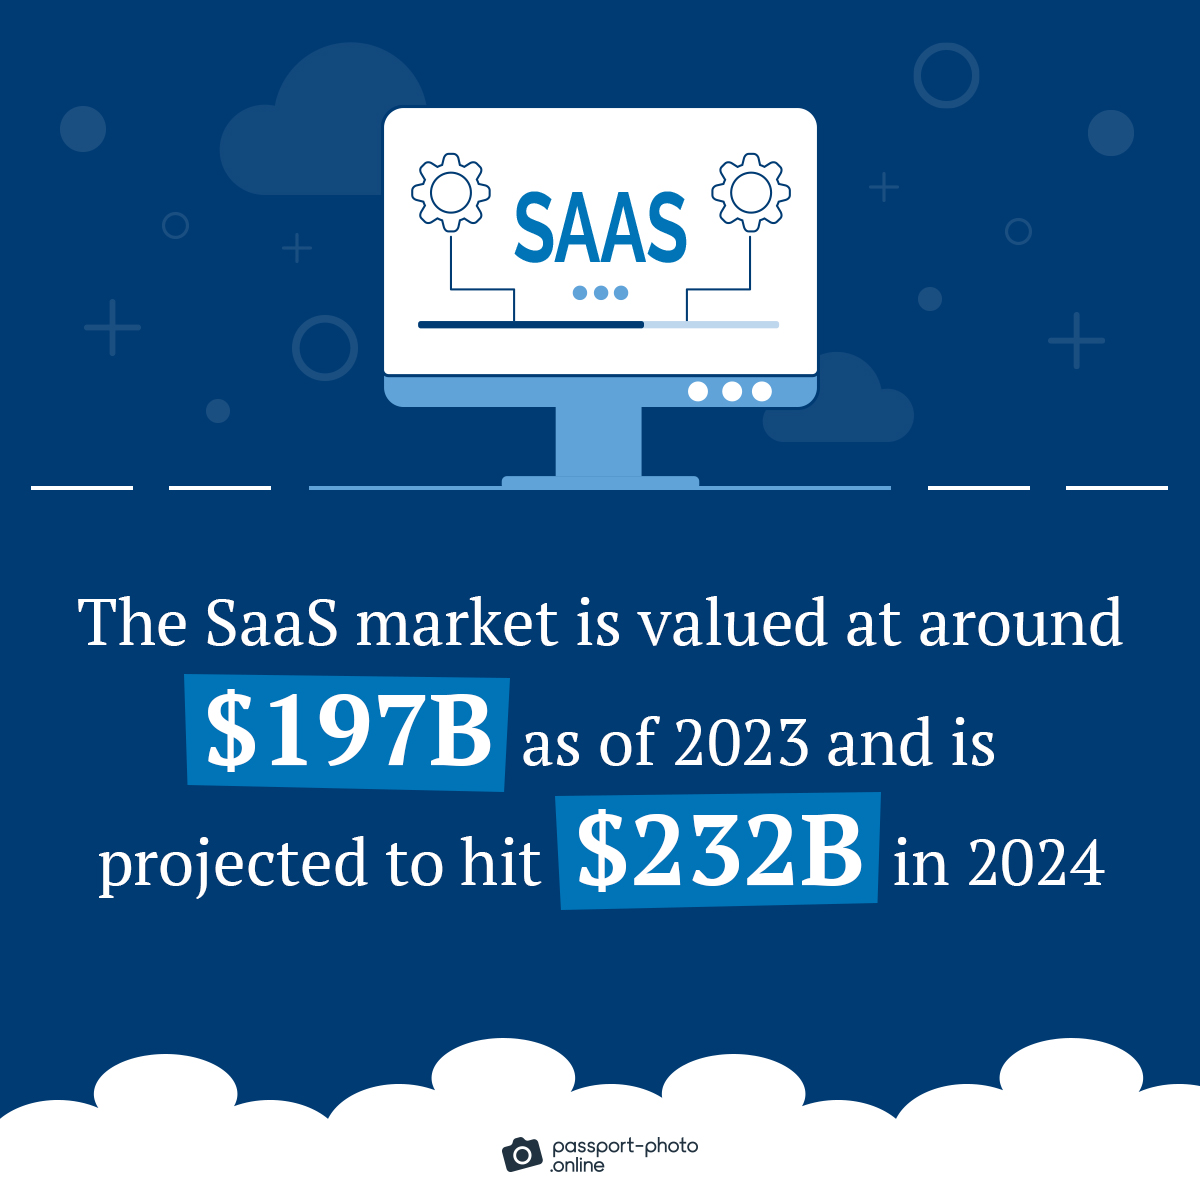
- The SaaS market is valued at around $197B as of 2023 and is projected to hit $232B in 2024.

- The SaaS sector has grown by more than 528% in the last eight years.
- The number of SaaS applications used by organizations worldwide rose to an average of 130 in 2022, compared to just eight in 2015.
- Companies estimate that 70% of their business apps are SaaS-based, and they anticipate this number to rise to 85% by 2025.
- The largest organizations, employing over 10,000 people, use 410 SaaS apps on average.
| SaaS Adoption by Company Size | Number of SaaS Applications Used |
|---|---|
| 200–749 | 80 |
| 750–2,999 | 192 |
| 3,000–9,999 | 152 |
| 10,000+ | 410 |
- Around 17,000 SaaS companies operate in the United States as of 2022.
- The median growth rate for SaaS companies reached 40% in 2022, an increase from the previous median of just under 30% in 2020.
- As of 2023, Adalo, ZenBusiness, and Printify are some of the fastest-growing SaaS companies.
| SaaS Companies | 5-Year Search Growth According to Exploding Topics |
|---|---|
| ZenBusiness | 9,800% |
| Adalo | 6,000% |
| Printify | 3,200% |
- Businesses spend an average of $2,623 per employee yearly on SaaS.

Looking for passport photos? Discover more information:
General SaaS Statistics, Facts, and Trends
- There are roughly 30,000 SaaS companies worldwide.
- Global end-user spending on cloud application services (SaaS) is projected to increase from $167,342M in 2022 to $197,288M in 2023 and $232,296M in 2024.
- The worldwide market for public cloud computing is anticipated to reach approximately $591B by 2023.
| Global End-User Spending on Public Cloud Services: 2019–2023 | In Billion US Dollars |
|---|---|
| 2019 | 243 |
| 2020 | 314 |
| 2021 | 412.63 |
| 2022* | 490.33 |
| 2023* | 591.79 |
- In 2022, Microsoft captured the largest share of SaaS revenue, accounting for 22.4% of the market.
- Salesforce, a leading SaaS company, saw its annual revenue rise from $26B in 2022 to $31B in its 2023 fiscal year.
| Top 3 Biggest SaaS Companies in the World | Market Capitalization in Billion US Dollars (as of June 2023) |
|---|---|
| Salesforce | 213 |
| Adobe Inc. | 200 |
| Intuit | 120 |
- The US leads the global SaaS market, with a value of ~$108.4B in 2020. This number will likely surge to $225B in 2025, reflecting a growth rate of over 100%.
- The United States boasts over 17,000 SaaS companies, more than eight times that of any other country.
| Leading SaaS Countries (as of 2022) | Number of Companies |
|---|---|
| United States | 17,000 |
| United Kingdom | 2,000 |
| Canada | 2,000 |
| Germany | 1,000 |
| France | 1,000 |
| India | 994 |
| China | 702 |
- The European SaaS market is projected to grow between 2020 and 2025, with Germany standing out for its substantial increase from €6.85B to €16.3B.
- The growth rate of cloud application services (SaaS) is projected to increase to 16.82% in 2023 from 16.06% in 2022.
- The SaaS market is valued at around $197B as of 2023 and is projected to reach $232B by 2024.
| Global End-User Spending on Public Cloud Application Services/SaaS: 2019–2024 | In Billion US Dollars |
|---|---|
| 2019 | 102.10 |
| 2020 | 120.70 |
| 2021 | 146.33 |
| 2022 | 167.34 |
| 2023* | 197.29 |
| 2024* | 232.30 |
- In June 2022, Qualtrics emerged as the top SaaS company in customer relationship management (CRM) and related software, generating revenue of over $800M.
| Top Global B2B SaaS CRM Companies (as of 2022) | Total Revenue in Million US Dollars |
|---|---|
| Qualtrics | 811.50 |
| Zoho | 500 |
| Freshworks | 338 |
| Sprinklr | 306 |
| Talkdesk | 229.50 |
SaaS in the Workplace
- SaaS accounted for 19% of companies’ worldwide IT expenditure in 2022.
- The average number of SaaS applications organizations use worldwide increased from eight in 2015 to 130 in 2022.
| Year | Number of SaaS Apps Used per Organization |
|---|---|
| 2015 | 8 |
| 2016 | 12 |
| 2017 | 17 |
| 2020 | 80 |
| 2021 | 110 |
| 2022 | 130 |
- As of 2023, large enterprises (with 10,000+ employees) use an average of 410 SaaS apps, a 14% decrease compared to 2021. This decline is likely due to consolidation efforts to optimize existing SaaS portfolios and gain better control over SaaS sprawl.
- Lack of centralized visibility and coordination in SaaS life cycles will lead organizations to overspend by a minimum of 25% through 2027, resulting from unnecessary entitlements and failure to rationalize overlapping tools and instances.
- By 2027, the adoption of SMPs (software management platforms) for centralized management among organizations using multiple SaaS applications will rise to 40%, up from under 25% in 2022.
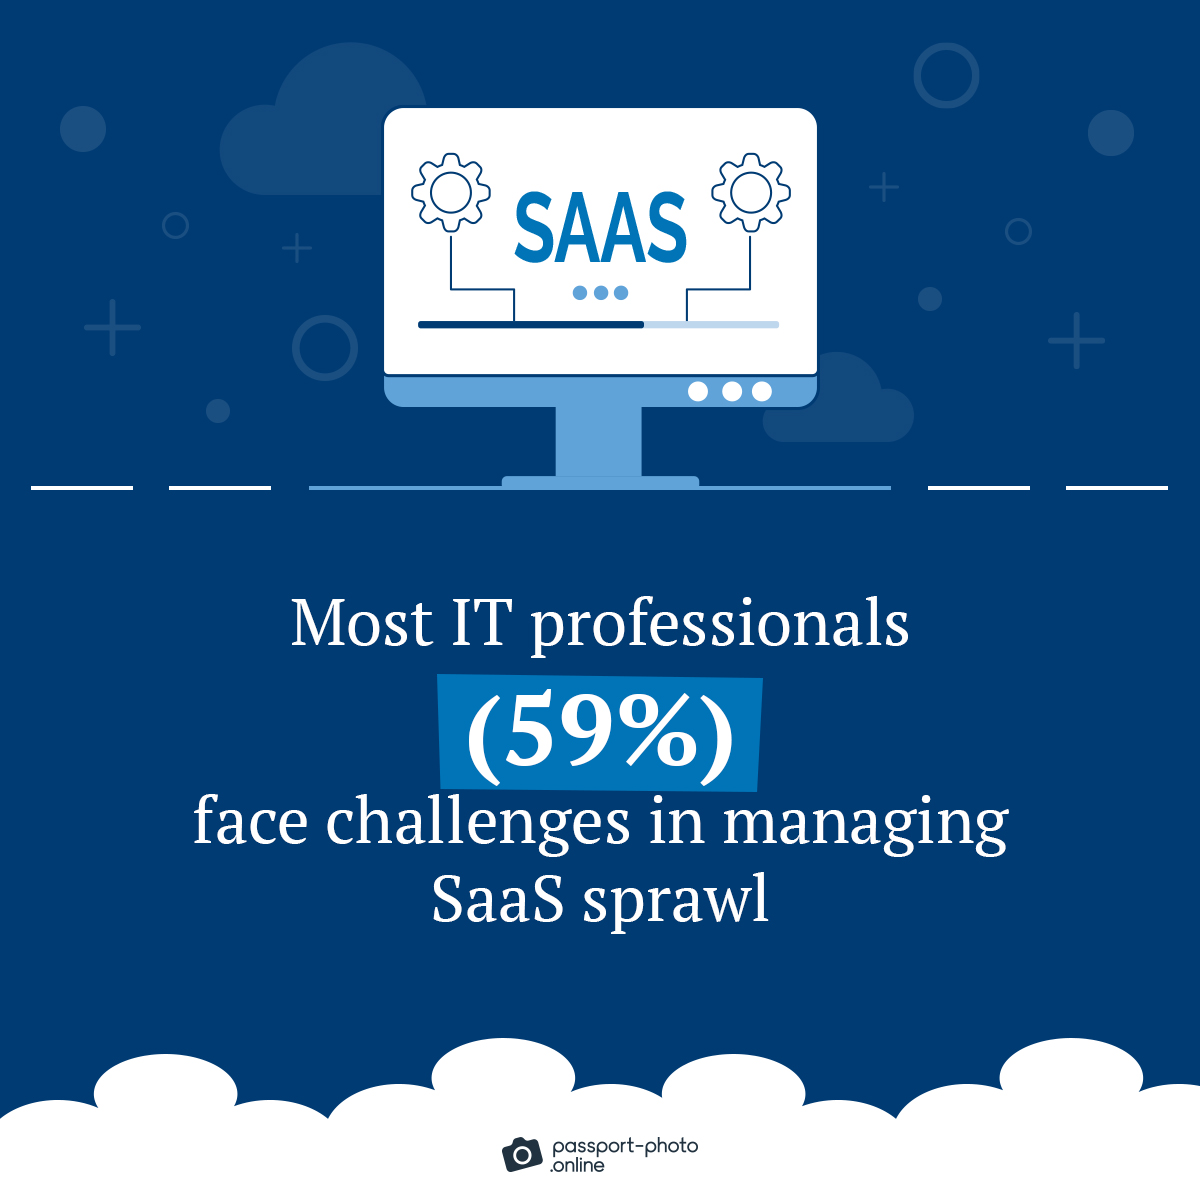
- Most IT professionals (59%) face challenges in managing SaaS sprawl.

- Unsanctioned SaaS apps, adopted without IT’s knowledge or approval, account for 65% of all SaaS applications.
- Consistently managing app configurations (42%) is a major challenge in SaaS environments.
| Key Challenges in SaaS Environments | Share |
|---|---|
| Managing all app configurations consistently | 42% |
| Getting visibility into all user activity, data files, and folders | 30% |
| Automating more SaaSOps tasks and/or helpdesk ticket resolutions | 30% |
| Knowing all SaaS apps in use | 27% |
| Onboarding and offboarding users manually | 26% |
- The significant majority of IT professionals (81%) are accountable for the protection of sensitive data in SaaS apps.
- While 86% of IT professionals recognize the importance of automation in managing SaaS operations, a significant majority (64%) struggle with limited insight and visibility to implement effective automation.
- Most enterprises (72%) envision zero-touch automation as the future of SaaSOps.
- Enhanced operational efficiency is the primary advantage of automating SaaS management, according to 32% of IT professionals.
| Key Benefits of Automating SaaS Management | Share |
|---|---|
| Improved operational efficiency | 32% |
| Better compliance or data security | 26% |
| Less human error or improved accuracy | 24% |
| Reduced IT spend | 13% |
| More time for strategic projects | 5% |
Stacking It All Up
There you have it.
A comprehensive list of SaaS statistics, facts, and trends.
Let us know in the comments if there are any other stats you’d like to see.
FAQ
How many SaaS companies are there?
What’s a good growth rate for a SaaS company?
How fast is the SaaS market growing?
How much do companies spend on SaaS per employee?
What’s the average number of SaaS applications used per organization?
Fair Use Statement
Did you like our infographics? If so, feel free to share them with your audience. Just remember to mention the source and link back to this page.
Sources
- BetterCloud, “2020 State of SaaSOps”
- BetterCloud, “2023 State of SaaSOps”
- Exploding Topics, “40 Skyrocketing SaaS Companies & Startups”
- Fortune Business Insights, “Software as a Service [SaaS] Market Size & Growth, 2022-2029”
- Gartner, “Gartner Forecasts Worldwide Public Cloud End-User Spending to Reach Nearly $600 Billion in 2023”
- GetLatka, “Top Countries for SaaS Companies”
- Insider Monkey, “10 Biggest SaaS Companies in the World”
- Insivia, “SaaS Statistics Infographic 2021”
- Reply, “Cloud and Edge Computing: A Trend Research”
- SaaS Capital, “2022 Growth Benchmarks for Private SaaS Companies”
- Statista, “Software as a Service – Statistics & Facts”

As a Digital PR specialist and a member of the Society of Professional Journalists (SPJ), Max has 5+ years of writing experience.
Over the course of his career, Max’s work has garnered significant attention, with features in numerous prominent publications such as The New York Times, Forbes, Inc., Business Insider, Fast Company, Entrepreneur, BBC, TechRepublic, Glassdoor, and G2.


