


The travel industry is rebounding.
For one, it contributed a whopping $1.1T to the national GDP in 2020, even despite the COVID-19 outbreak and travel restrictions that followed.
Two, with remote work and hybrid setups now reigning supreme, most Americans are eager to turn on their out-of-office alerts and hit the road.
So—
At Passport Photo Online, we’ve decided to put together a comprehensive list of 152+ travel statistics and facts for 2026 to help you stay ahead of the curve.
General Leisure Travel Statistics
- When planning a trip, Americans’ most important considerations are affordability, safety, and flexibility.
(Airbnb, Report on Travel & Living, 2021)
- For nearly 47% of travelers, who they are with and what they do together is more important than where they go and what they see.
(Airbnb, Report on Travel & Living, 2021)
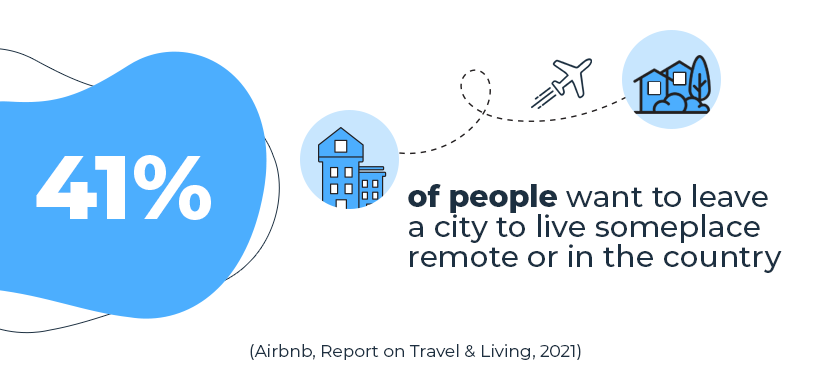
- 41% of people want to leave a city to live someplace remote or in the country.
(Airbnb, Report on Travel & Living, 2021)
- 64% of tourists are interested in traveling during off-peak times.
(Airbnb, Report on Travel & Living, 2021)
- City-centric trips are gaining ground, with searches going up for major cities such as Las Vegas (+40%), Melbourne (+90%), Paris (+30%), and Sydney (+85%).
(Expedia, Traveler Value Index, 2021)
- Three-quarters of consumers are likely to pick a destination they’ve never visited.
(Expedia, Traveler Value Index, 2021)
- Nearly 52% of travelers that have a trip planned will likely use a mode of transportation they’ve never used before.
(Expedia, Traveler Value Index, 2021)
- About 22% look for once-in-a-lifetime experiences on their next trip.
(Expedia, Traveler Value Index, 2021)
- 60% of travelers choose domestic travel for the short term.
(Expedia, Traveler Value Index, 2021)
- More consumers prefer to take frequent, shorter trips (41%) than those who want fewer, longer trips (28%) or a mixture of both (31%).
(Expedia, Traveler Value Index, 2021)
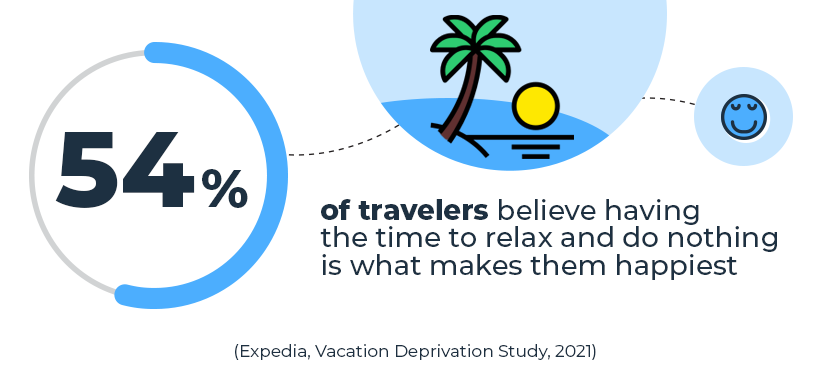
- 54% of travelers believe having the time to relax and do nothing is what makes them happiest.
(Expedia, Vacation Deprivation Study, 2021)
- Merely thinking about travel makes people feel much happier (by 18 percentage points) and more hopeful (by nine points) than they otherwise do on a regular day.
(Airbnb, From Isolation To Connection—Travel in 2021)
- Americans prioritize travel to be close to family (32%). Yet, they equally prioritize a new experience or destination (31%), ideally nearby, followed by a return to a favorite spot (25%).
(Airbnb, From Isolation To Connection—Travel in 2021)
- 56% prefer a domestic or local destination compared to just 21% who want to travel internationally.
(Airbnb, From Isolation To Connection—Travel in 2021)
- One in five want their destination to be within driving distance of home. As a result, travel by car draws the most interest, beating air travel by 17 points.
(Airbnb, From Isolation To Connection—Travel in 2021)
- Over half (51%) want to be isolated beyond major tourist areas rather than being “surrounded by people and energy” (24%).
(Airbnb, From Isolation To Connection—Travel in 2021)
- A quarter of Americans are open to traveling during off-peak times.
(Airbnb, From Isolation To Connection—Travel in 2021)
- Just 21% of those who took a cruise trip in the past say they’ll do it again.
(ABTA, Six Trends for Travel in 2021)
- 58% of people are interested in an ocean cruise, and 31% would like to go on a river cruise.
(ABTA, Six Trends for Travel in 2021)
- Most Americans agree that travel creates greater cultural understanding (63%) and makes you more connected to the world (62%).
(Expedia, 2021 Travel Trends Report)
- Four in five domestic trips people take are for leisure.
(US Travel Association)
- International travel spending supports around 1.2M US jobs and accounts for $33.6B in wages.
(US Travel Association)
- Top leisure travel activities in the US for overseas visitors:
- Shopping
- Sightseeing
- Fine dining
- National parks/monuments
- Amusement/theme parks
(US Travel Association)
- 64% of leisure US travelers find accommodation, and 68% find trip experiences online.
(Facebook IQ, 2018)
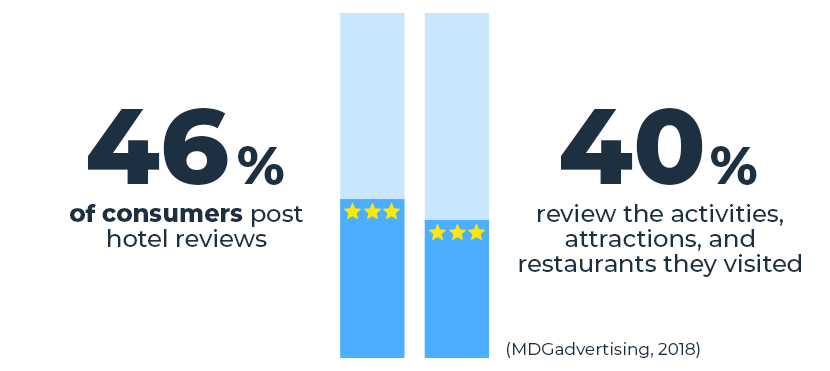
- 46% of consumers post hotel reviews. Another 40% review the activities, attractions, and restaurants they visited.
(MDGadvertising, 2018)
Travel vs. Work: Facts and Stats
- 19% of Airbnb Homes guests used Airbnb to travel and work remotely in 2020.
(Airbnb, Report on Travel & Living, 2021)
- 55% of Airbnb long-term stay bookers worked or studied during their stay.
(Airbnb, Report on Travel & Living, 2021)
- 72% of consumers consider flexibility the key driver for business travel.
(Concur, Global Business Traveler Report 2021)
- 52% of business travelers expect the freedom to book direct flights.
(Concur, Global Business Traveler Report 2021)
- Around 42% hold themselves most accountable for their health and safety on a trip.
(Concur, Global Business Traveler Report 2021)
- Among the essential perks of business travel are the ability to choose accommodation (46%) and mode of transport (43%).
(Concur, Global Business Traveler Report 2021)
- Direct spending on business travel by domestic and international travelers totaled $334.2B in 2019. That included expenditures on meetings, events, and incentive programs.
(US Travel Association)
- Americans logged 464.4M business trips in 2019, with 38% for meetings and events.
(US Travel Association)
- The jobs supported by travel expenditures include 9M in the travel industry and 6.8M in related sectors.
(US Travel Association)
- The amount of wages shared by American workers directly employed by travel is $277.4B.
(US Travel Association)
- The percentage of America’s GDP attributed to travel and tourism is 2.9%.
(US Travel Association)
- One in 10 US jobs are dependent on travel and tourism.
(US Travel Association)
- Employment-wise, travel is among the top 10 industries in 49 states and D.C.
(US Travel Association)
- Business travelers make up 12% of airlines’ passengers. Yet, they represent 75% of the profit.
(Investopedia, How Much Airline Revenue Comes From Business Travelers, 2020)
- The global market for business travel is expected to fully recover by 2026. At this point, it’ll likely reach $829.5B.
(ReportLinker, 2020)
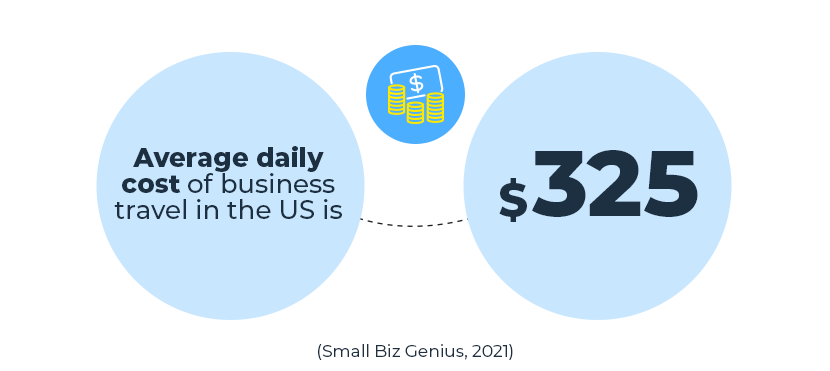
- The average daily cost of business travel in the US is $325.
(Small Biz Genius, 2021)
- Companies spend roughly $1,425 for every employee who goes on a business trip.
(Fyle, 2020)
- The average business travel budget consists of:
- Lodging (34%)
- Airfare (27%)
- Meals (20%)
- Car rentals (19%)
(Travel Pulse, 2020)
- For nearly 70% of business travelers, the key considerations in booking airline tickets after COVID-19 are flexibility in cancellation and changing ticket conditions.
(Skift Research & McKinsey, 2020)
- Over 700K businesses used “Airbnb for Work” for corporate trips in 2018.
(PhocusWire, 2018)
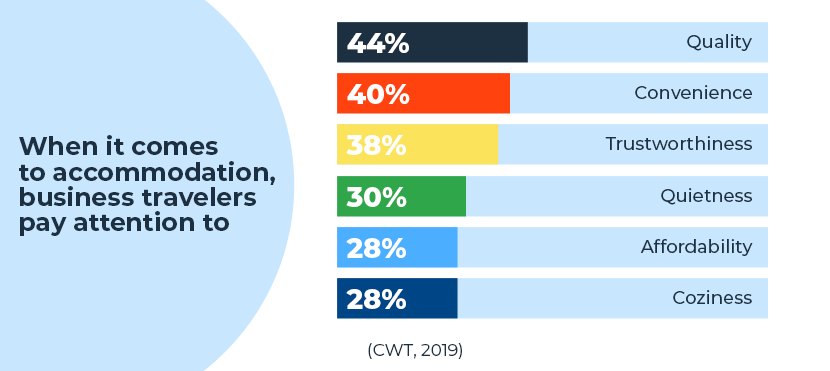
- When it comes to accommodation, business travelers pay attention to:
- Quality (44%)
- Convenience (40%)
- Trustworthiness (38%)
- Quietness (30%)
- Affordability (28%)
- Coziness (28%)
(CWT, 2019)
- 91% of corporate travel managers believe business travel is essential to organizational growth.
(Skift + TripActions, The State of Business Travel, 2020)
Statistics on Travelers’ Spending Habits
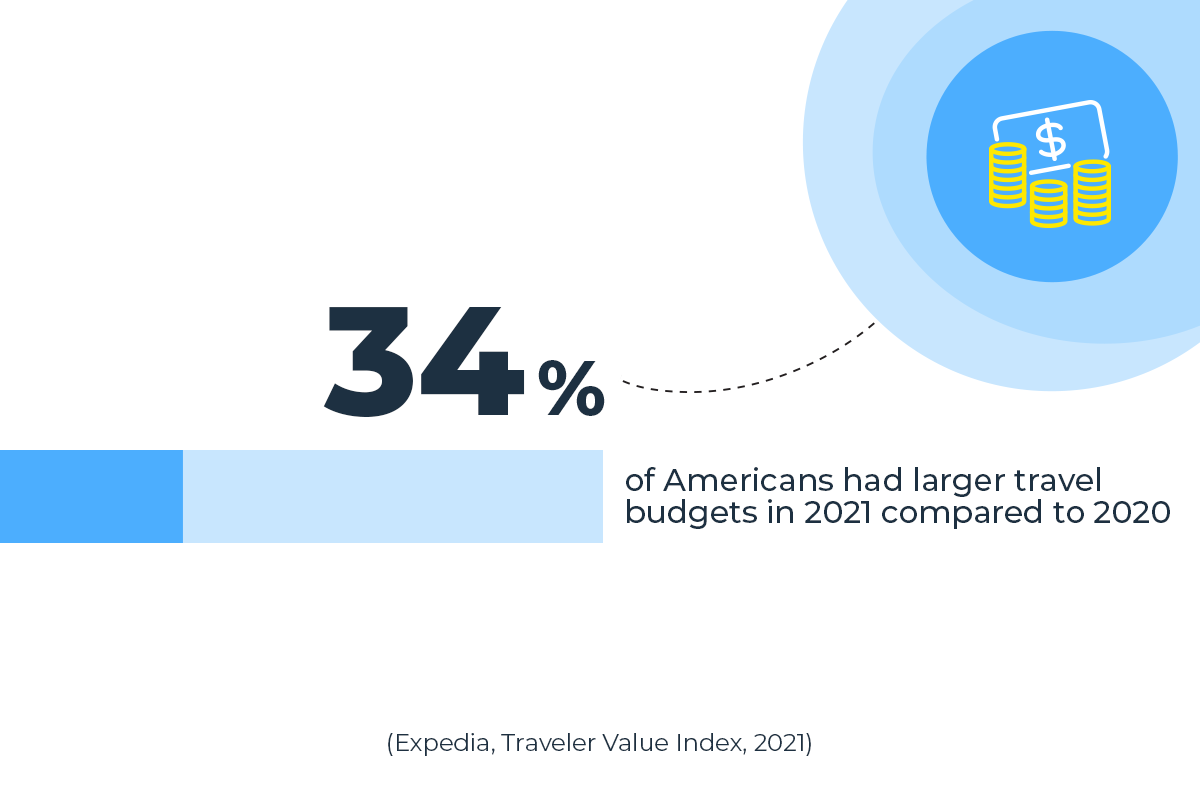
- Over a third of people (34%) had larger travel budgets in 2021 compared to 2020.
(Expedia, Traveler Value Index, 2021)
- To save money for travel, 43% of Americans would limit dining out or takeout, and 38% would give up alcohol.
(Expedia, Traveler Value Index, 2021)
- One in four travelers most value the ability to get a full refund across all travel experiences.
(Expedia, Traveler Value Index, 2021)
- Most people (52%) want to see a range of prices and options for a specific type of experience, as well as the ability to book accommodation and transportation in one transaction (38%).
(Expedia, Traveler Value Index, 2021)
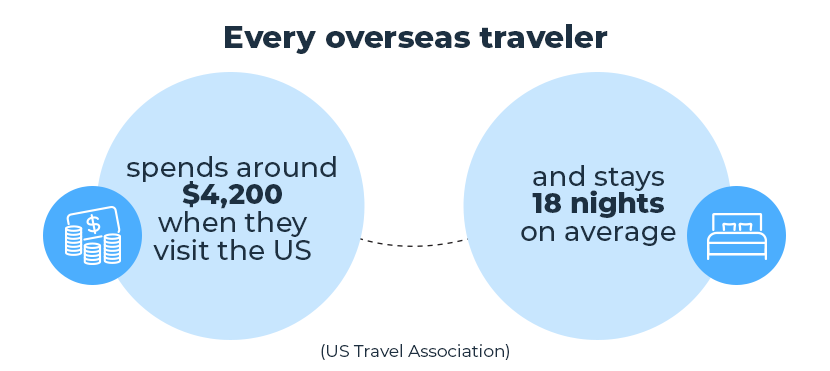
- Every overseas traveler spends around $4,200 when they visit the US and stays 18 nights on average.
(US Travel Association)
- Direct spending by resident and international travelers in the US averaged $3.1B a day.
(US Travel Association)
- Travel accounts for around 2% of the total annual budgets of all US households.
(ValuePenguin)
- For a typical trip within the US, people spend an average of $581 and go away for about four nights.
(ValuePenguin)
- The typical vacationing US family spends about 44% of their travel funds getting to, from, and around their destinations.
(ValuePenguin)
- Americans spend an average of $33 per day on food when vacationing in their home country.
(ValuePenguin)
- On international trips, however, Americans spend about $35 per day—nearly 90% of those funds go to restaurant meals.
(ValuePenguin)
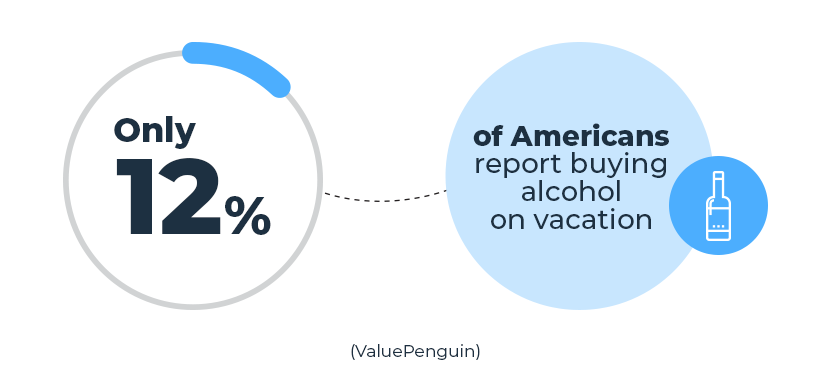
- Only 12% of Americans report buying alcohol on vacation.
(ValuePenguin)
- People who travel spend about 9% of their budget on entertainment. That’s about $52, on average, for a domestic trip and $293 while abroad.
(ValuePenguin)
- Around 68% of travelers want to see their money reinvested in the local economy.
(Regiondo, Where Travel Is Going in 2021)

Looking for passport photos? Discover more information:
Air Travel: Facts & Stats
- The total number of flights operated in July 2021 reached 86% of pre-pandemic levels.
(US Department of Transportation, Air Travel Consumer Report, 2021)
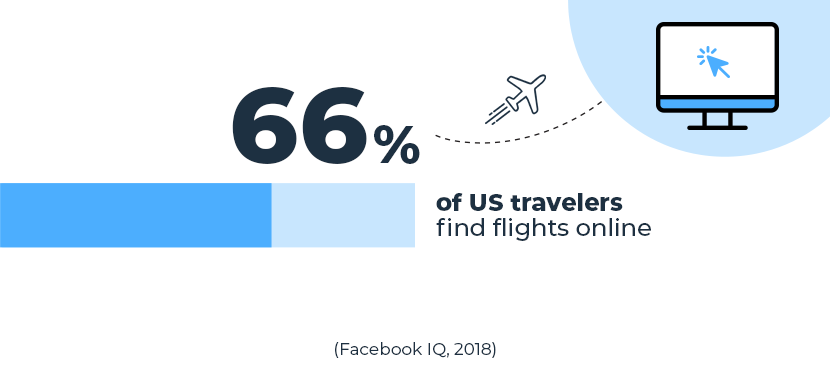
- 66% of US travelers find flights online.
(Facebook IQ, 2018)
- 53% of flight shoppers in the US who are on Facebook use it to see travel pictures from friends and family.
(Facebook IQ, 2018)
- A little over half of Americans claim that once they decide to go on a trip, they spend less than a week researching flights.
(Facebook IQ, 2018)
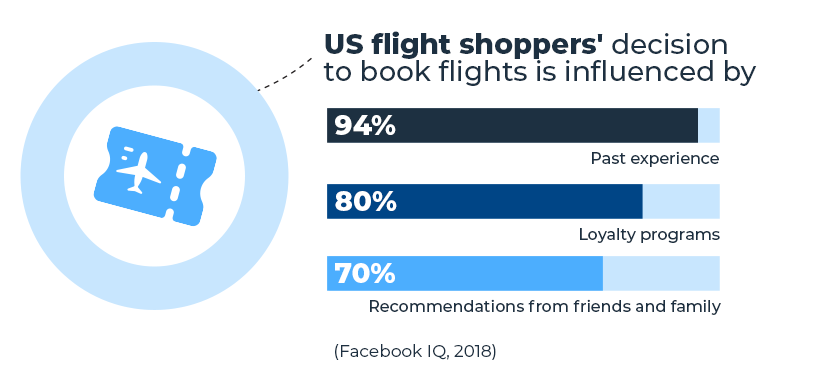
- US flight shoppers’ decision to book flights is influenced by:
- Past experiences (94%)
- Loyalty programs (80%)
- Recommendations from friends and family (70%)
(Facebook IQ, 2018)
- 71% of US travelers book flights at least one month ahead of the trip.
(Facebook IQ, 2018)
- Nearly 65% of flight shoppers want post-purchase engagement from brands, with live updates and discounts being the most desired updates.
(Facebook IQ, 2018)
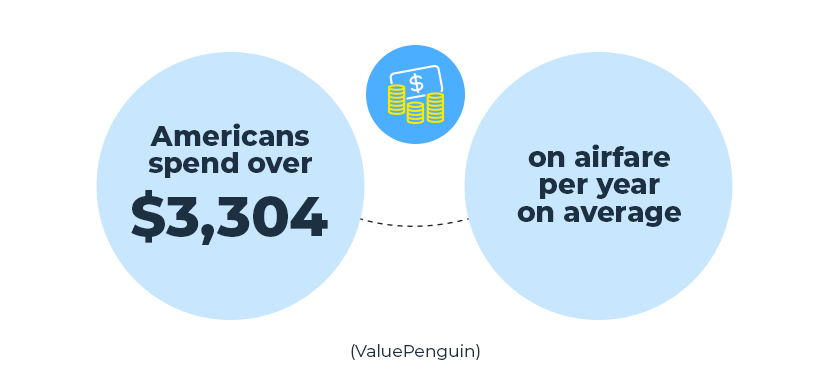
- Americans spend over $3,304 on airfare per year on average.
(ValuePenguin)
Statistics on Accommodation Booking
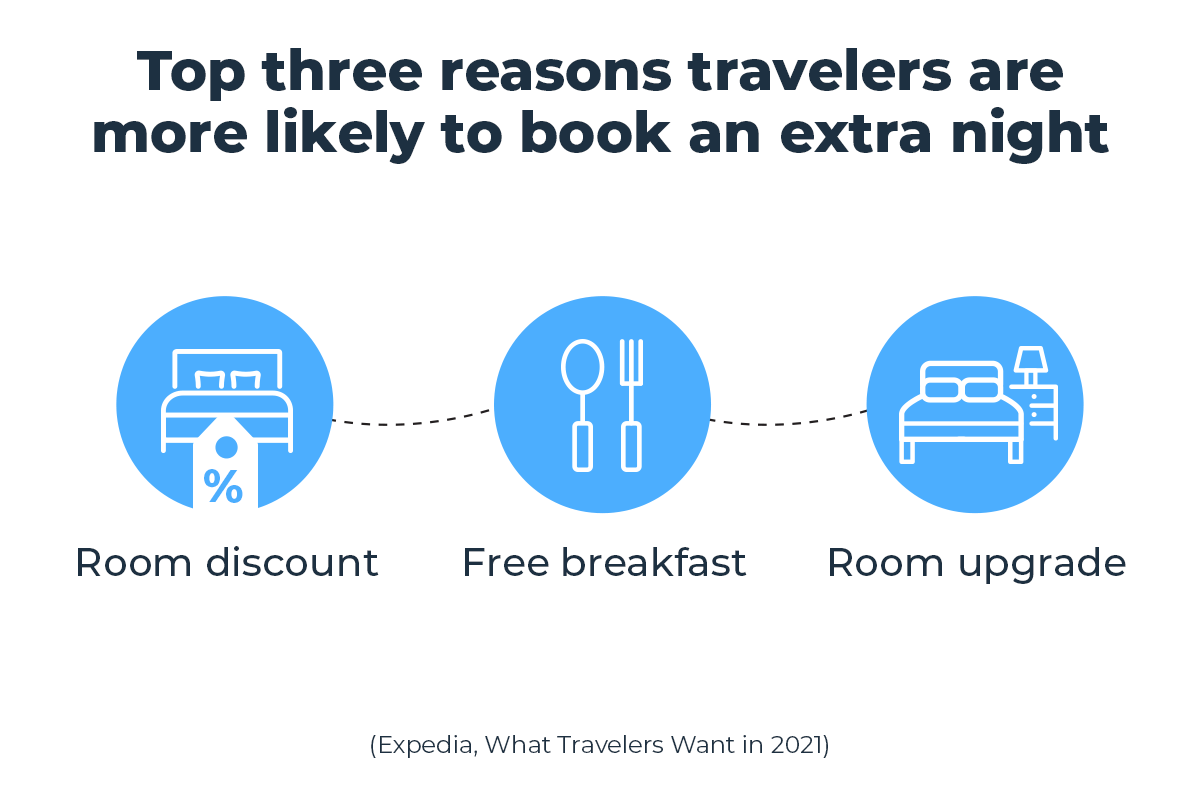
- The top three reasons travelers are more likely to book an extra night:
- Room discount
- Free breakfast
- Room upgrade
(Expedia, What Travelers Want in 2021)
- Affordability is the key priority when choosing accommodation, beating health and safety protocols by 10 points.
(Airbnb, From Isolation To Connection—Travel in 2021)
- Around 75% of Americans want to search for accommodation within a range of dates.
(Airbnb, Report on Travel & Living, 2021)
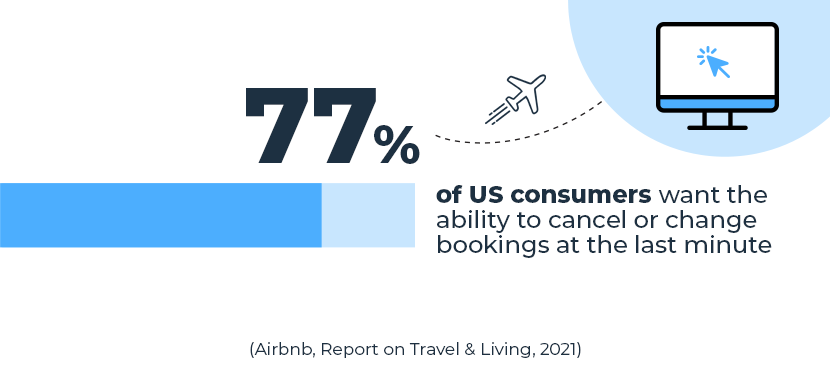
- 77% of US consumers want the ability to cancel or change bookings at the last minute.
(Airbnb, Report on Travel & Living, 2021)
- The percentage of long-term stays (28 nights or more) on Airbnb nearly doubled from 14% of nights booked in 2019 to 24% in Q1 2021.
(Airbnb, Report on Travel & Living, 2021)
- 48% of travelers are open to booking via sites and companies they’ve never used if they believe the travel provider is trustworthy.
(Expedia, Traveler Value Index, 2021)
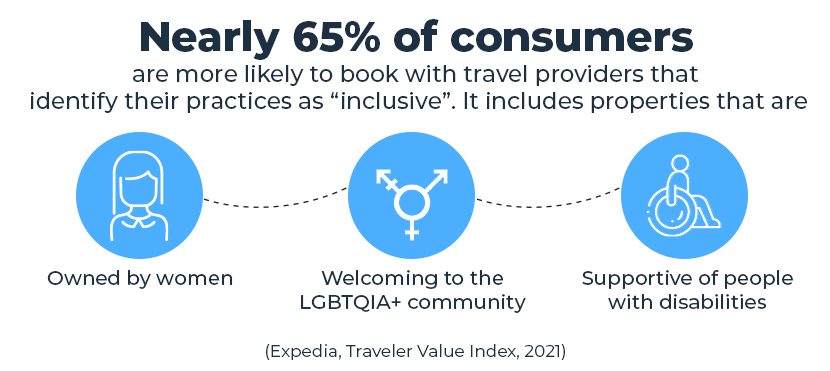
- Nearly 65% of consumers are more likely to book with travel providers that identify their practices as “inclusive.” It includes properties that are:
- Owned by women
- Welcoming to the LGBTQIA+ community
- Supportive of people with disabilities
(Expedia, Traveler Value Index, 2021)
- For 57% of consumers, detailed photos give them the confidence to book accommodation.
(Expedia, What Travelers Want in 2021)
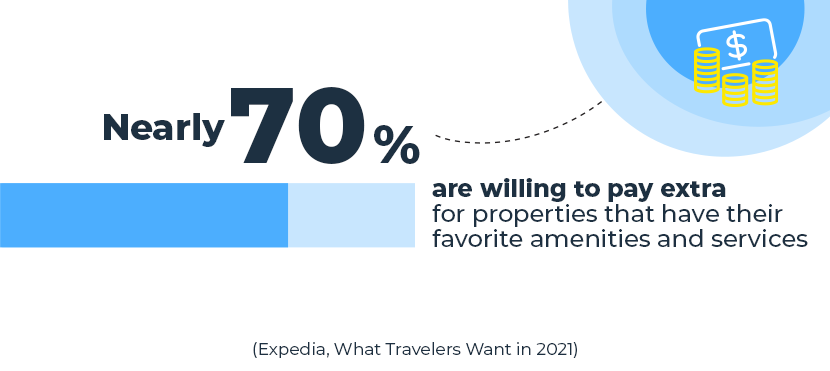
- Nearly 70% are willing to pay extra for properties that have their favorite amenities and services.
(Expedia, What Travelers Want in 2021)
- 89% of travelers want to see some information or features of the surrounding location.
(Expedia, What Travelers Want in 2021)
- Nearly 60% of travelers are unlikely to book a non-refundable room in exchange for a reduced rate.
(Expedia, What Travelers Want in 2021)
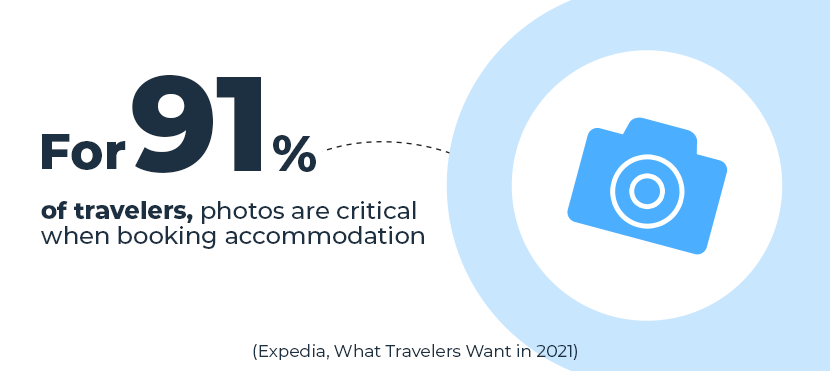
- For most travelers (91%), photos are critical when booking accommodation.
(Expedia, What Travelers Want in 2021)
- Consumers view an average of nine photos before making a booking decision.
(Expedia, What Travelers Want in 2021)
- 87% want to receive information from the chosen accommodation before check-in.
(Expedia, What Travelers Want in 2021)
- For 77%, accommodation must have core technology amenities.
(Expedia, What Travelers Want in 2021)
- One in three travelers want to see destination messaging regarding social-distancing measures and cleanliness standards.
(Expedia, What Travelers Want in 2021)
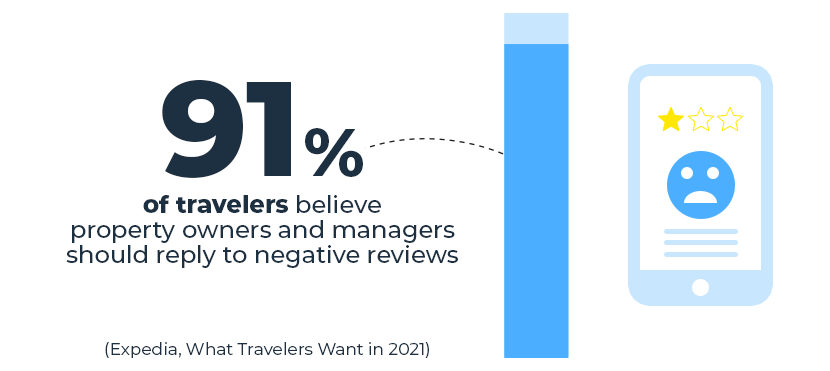
- 91% of travelers believe property owners and managers should reply to negative reviews.
(Expedia, What Travelers Want in 2021)
- Only 9% of consumers believe there’s nothing properties could do to make them feel more comfortable after reading a negative review.
(Expedia, What Travelers Want in 2021)
Importance of Sustainability: Statistics and Facts
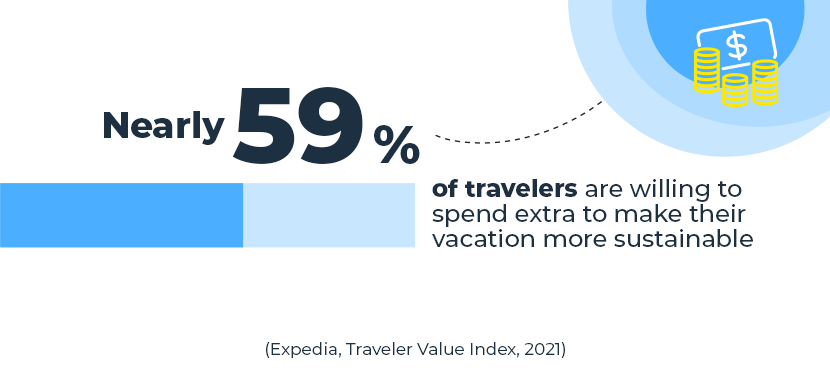
- Nearly 59% of travelers are willing to spend extra to make their vacation more sustainable.
(Expedia, Traveler Value Index, 2021)
- 56% of people under 50 would be “much” or “somewhat more likely” to use an online platform that lets them search for green accommodation. Yet, only 28% of those aged 50+ would follow suit.
(Airbnb, From Isolation To Connection—Travel in 2021)
- In 2011, only 19% of people were more likely to choose one company over another based on a better environmental record, compared to 38% in 2020.
(ABTA, Six Trends for Travel in 2021)
- 61% of travelers claim the pandemic made them want to travel more sustainably in the future.
(Booking.com, Sustainable Travel Report 2021)
- For 49% of people, COVID-19 has encouraged them to make positive changes in their everyday lives.
(Booking.com, Sustainable Travel Report 2021)
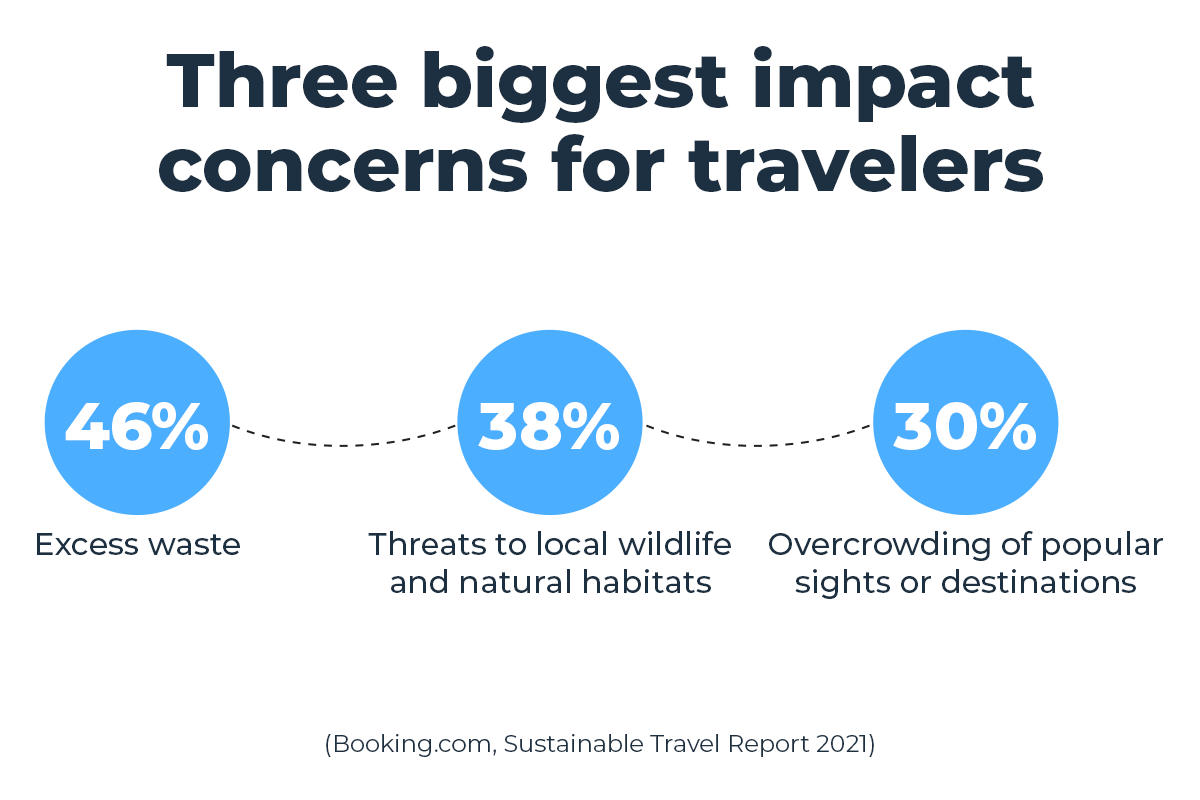
- The three biggest impact concerns for travelers are:
- Excess waste (46%)
- Threats to local wildlife and natural habitats (38%)
- Overcrowding of popular sights or destinations (30%)
(Booking.com, Sustainable Travel Report 2021)
- 76% of travelers say they’ll seek accommodation with reputable third-party sustainability accreditation.
(Booking.com, Sustainable Travel Report 2021)
- Nearly 73% would be more likely to choose accommodation with sustainability practices.
(Booking.com, Sustainable Travel Report 2021)
- 40% of travelers believe it’d be helpful if booking sites used a clear label that showed if the accommodation was more sustainable.
(Booking.com, Sustainable Travel Report 2021)
- Almost 40% would like booking sites to offer a sustainable filter option.
(Booking.com, Sustainable Travel Report 2021)
- 35% want travel companies to provide tips on how to adopt better sustainability practices while traveling.
(Booking.com, Sustainable Travel Report 2021)
- 72% believe travel companies should offer more sustainable choices.
(Booking.com, Sustainable Travel Report 2021)
- 41% of travelers don’t know how to find sustainable travel options.
(Booking.com, Sustainable Travel Report 2021)
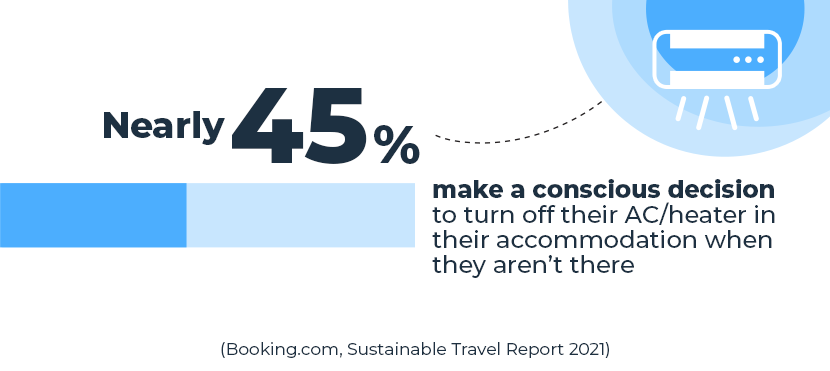
- Nearly 45% make a conscious decision to turn off their AC/heater in their accommodation when they aren’t there.
(Booking.com, Sustainable Travel Report 2021)
- 43% took their reusable water bottle to avoid buying bottled water while on vacation.
(Booking.com, Sustainable Travel Report 2021)
- 40% of travelers reused the same towel to reduce water usage.
(Booking.com, Sustainable Travel Report 2021)
- 42% shopped at small, independent stores to support the local economy during their stay.
(Booking.com, Sustainable Travel Report 2021)
- 27% of people believe properties should offer the option to opt out of daily room cleaning to lower water usage.
(Booking.com, Sustainable Travel Report 2021)
- About 27% of travelers would prefer only being offered reusable plates and cutlery for all meals, including room service.
(Booking.com, Sustainable Travel Report 2021)
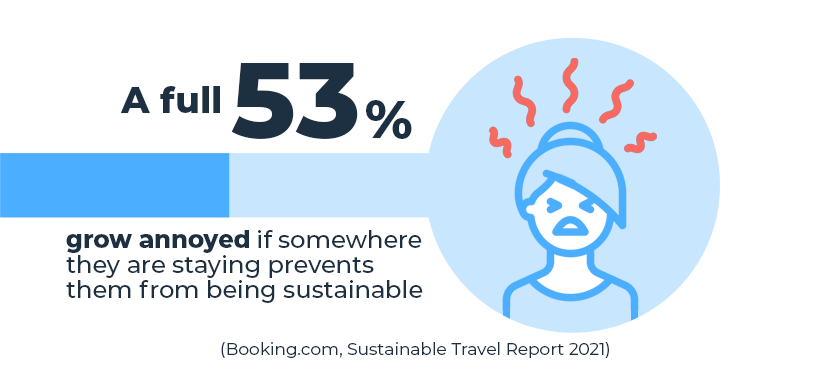
- A full 53% grow annoyed if somewhere they are staying prevents them from being sustainable.
(Booking.com, Sustainable Travel Report 2021)
Smartphone Use On Vacation: Stats
- Nearly 93% of travelers are compelled to take phones on vacation.
(BankMyCell, Digital Detox on Vacation, 2019)
- 42% of consumers use smartphones to research trips.
(MDGadvertising, 2018)
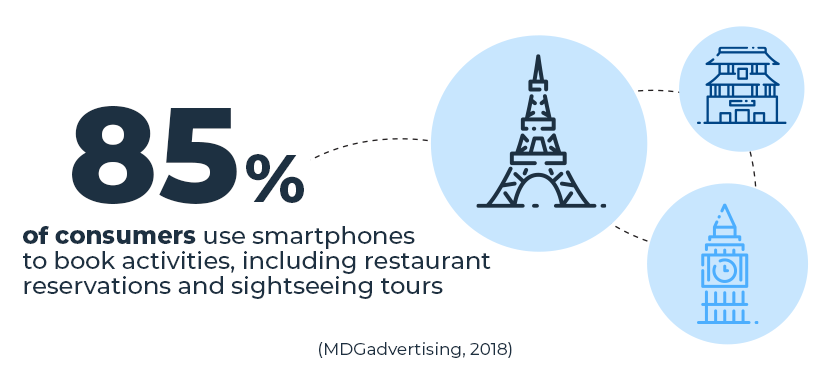
- 85% of consumers use smartphones to book activities, including restaurant reservations and sightseeing tours.
(MDGadvertising, 2018)
- 60% of travelers rely on phones for navigation.
(MDGadvertising, 2018)
- Women are 1.8X more likely than men to discover flights via mobile.
(Facebook IQ, 2018)
- 33% of US travelers aged 18–34 book flights via smartphones.
(Facebook IQ, 2018)
- 58% of Americans that bought airline tickets on mobile did so because it was more convenient.
(Facebook IQ, 2018)
- 64% of travelers use smartphones en route to their destination.
(Travelport, 2018 Digital Traveler Survey)
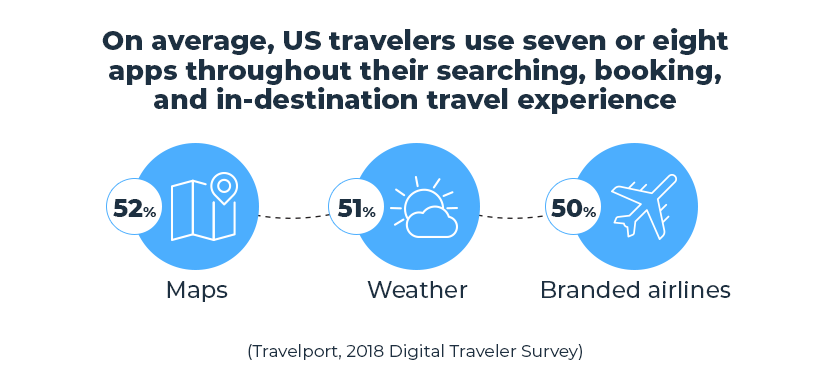
- On average, US travelers use seven or eight apps throughout their searching, booking, and in-destination travel experience: maps (52%), weather (51%), and branded airlines (50%) top the list.
(Travelport, 2018 Digital Traveler Survey)
- Over 50% of US travelers would prefer to use an app for adding extras to their bookings on the go.
(Travelport, 2018 Digital Traveler Survey)
- The ability to pay using Apple/Android Pay within travel apps is an essential feature for 42% of US travelers.
(Travelport, 2018 Digital Traveler Survey)
- 44% of travelers have used voice to search for some part of their trip, with 20% of US tourists considering voice search a major influencer.
(Travelport, 2018 Digital Traveler Survey)
- Nearly 39% want to use a digital room key on their smartphone to unlock their hotel room door.
(Travelport, 2018 Digital Traveler Survey)
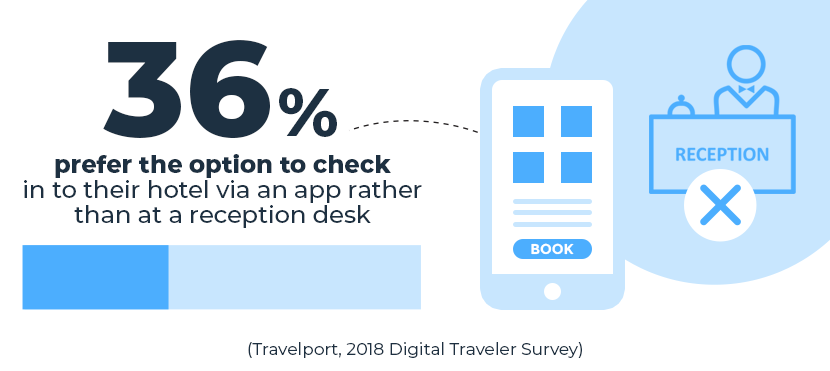
- 36% prefer the option to check in to their hotel via an app rather than at a reception desk.
(Travelport, 2018 Digital Traveler Survey)
- 66% of US consumers agree digital boarding passes make travel “so much easier.”
(Travelport, 2018 Digital Traveler Survey)
- Almost 50% of US travelers want to “live chat with a travel representative” via a favorite travel app.
(Travelport, 2018 Digital Traveler Survey)
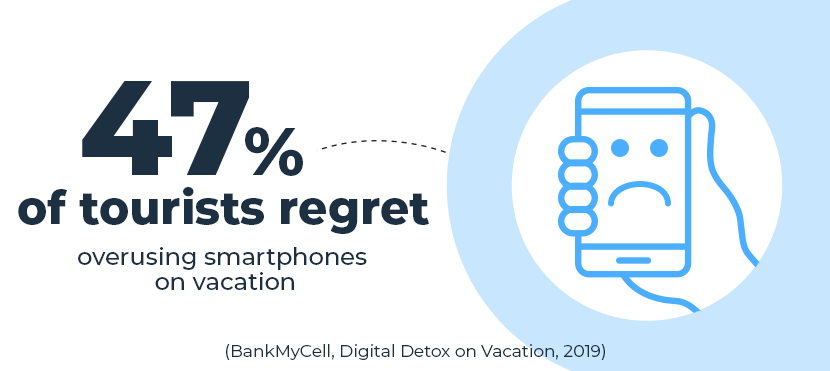
- 47% of tourists regret overusing smartphones on vacation.
(BankMyCell, Digital Detox on Vacation, 2019)
- For 93% of people, the camera is the most used smartphone function abroad.
(BankMyCell, Digital Detox on Vacation, 2019)
- 37% of vacationers send and respond to emails.
(BankMyCell, Digital Detox on Vacation, 2019)
- 36% of people grow angry by their companion’s constant selfie- and photo-taking.
(BankMyCell, Digital Detox on Vacation, 2019)
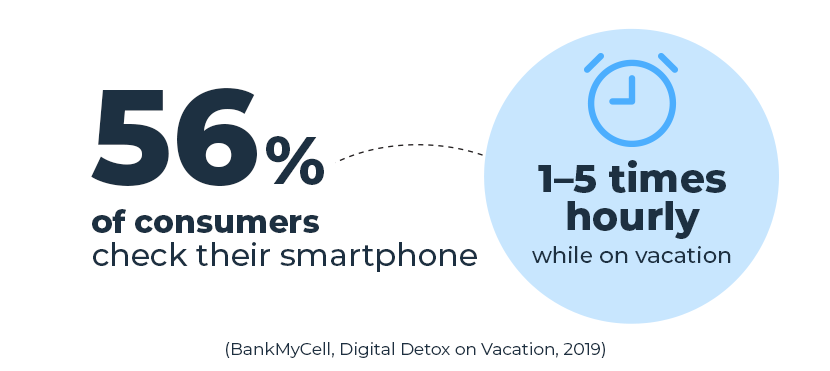
- 56% of consumers check their smartphone 1–5 times hourly while on vacation.
(BankMyCell, Digital Detox on Vacation, 2019)
- Half of travelers believe having a smartphone on vacation makes it impossible to unplug.
(BankMyCell, Digital Detox on Vacation, 2019)
Social Media’s Role in Travel: Trivia Facts and Statistics
- Travelers aged 18–34 use Facebook apps (now Meta) as the number one channel for destination discovery online.
(Facebook IQ, 2018)
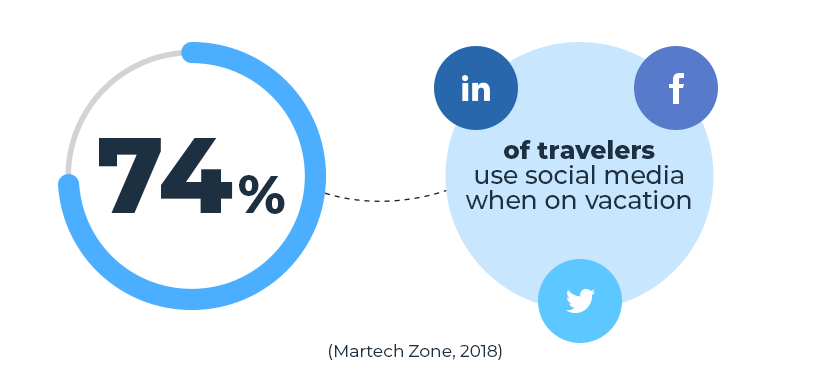
- 74% of travelers use social media when on vacation.
(Martech Zone, 2018)
- 97% of Millennials share photos on social media when traveling, compared to 60% of other demographics.
(Martech Zone, 2018)
- Nearly 34% of US travelers take to social media when considering a trip.
(MDGadvertising, 2018)
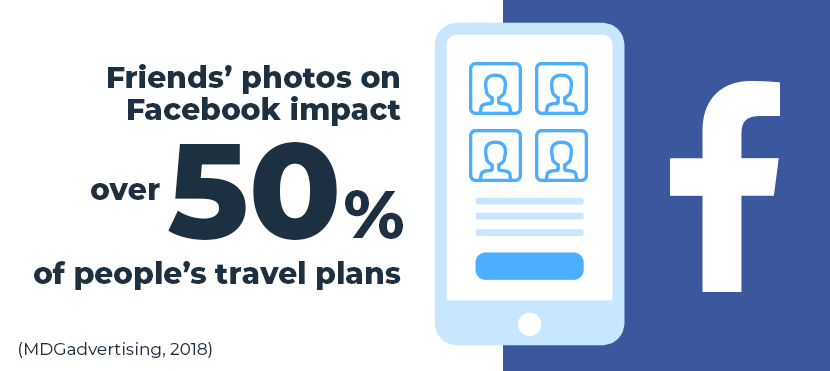
- Friends’ photos on Facebook impact over 50% of people’s travel plans.
(MDGadvertising, 2018)
- 59% of travelers post an update on social media about an upcoming trip.
(MDGadvertising, 2018)
- Most Americans (74%) use social media tools during vacation.
(MDGadvertising, 2018)
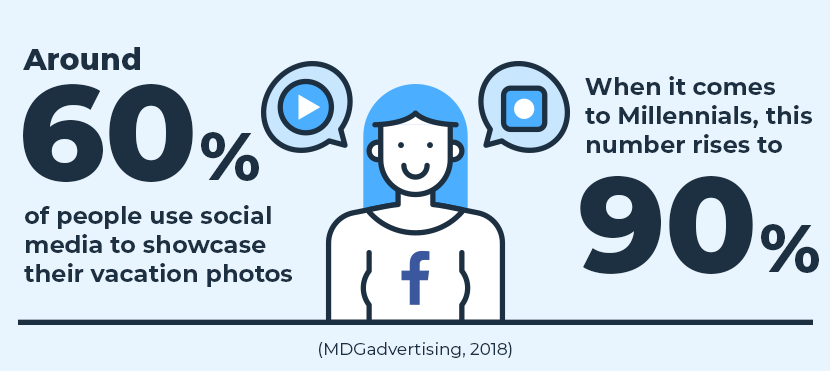
- Around 60% of people use social media to showcase their vacation photos. When it comes to Millennials, this number rises to 90%.
(MDGadvertising, 2018)
- 55% of travelers like Facebook pages specific to their trip.
(MDGadvertising, 2018)
- 72% of people often use social media on their getaways.
(BankMyCell, Digital Detox on Vacation, 2019)
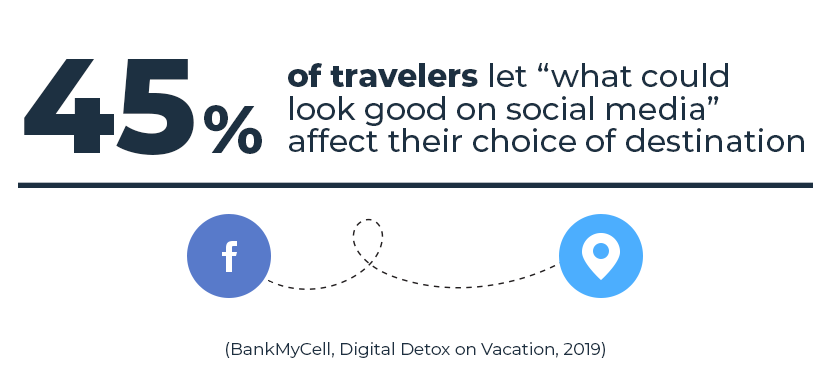
- 45% of travelers let “what could look good on social media” affect their choice of destination.
(BankMyCell, Digital Detox on Vacation, 2019)
COVID-19 vs. Travel: Statistics
- Nearly half of travelers are afraid of catching the virus while using public transportation.
(Booking.com, The Future of Travel, 2020)
- Getaways were the second most popular trip type people were interested in right after beach trips, one year after the COVID-19 pandemic began.
(Airbnb, Report on Travel & Living, 2021)
- 42% of people will opt for longer-stay travel after the pandemic.
(Airbnb, Report on Travel & Living, 2021)
- About three-quarters of people are comfortable with the concept of a vaccine passport.
(Expedia, Traveler Value Index, 2021)
- For 75% of travelers, a vacation would make them happier than a new phone.
(Expedia, What Travelers Want in 2021)
- Nearly 81% of working adults place more value on vacations post-pandemic. Of those, 66% even created a bucket list of places to visit.
(Expedia, What Travelers Want in 2021)
- Seven in 10 travelers were ready to drive up to six hours for a trip amid the pandemic.
(Expedia, What Travelers Want in 2021)
- 42% of travelers canceled one or more trips in 2020 due to COVID-19.
(Expedia, Vacation Deprivation Study, 2021)
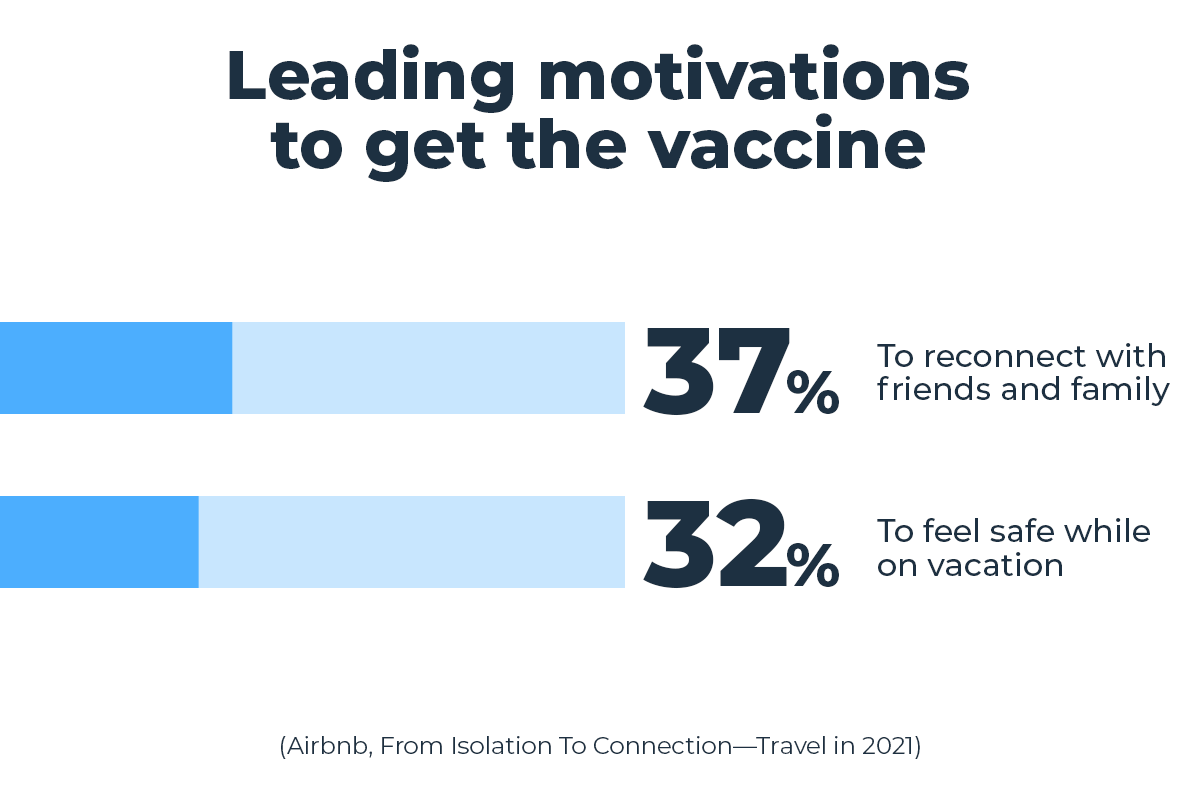
- The leading motivations to get the vaccine were to reconnect with friends and family (37%) and to feel safe while on vacation (32%).
(Airbnb, From Isolation To Connection—Travel in 2021)
- 32% of travelers want “most people” at a destination to also be vaccinated to consider traveling there. Nearly a third also want testing to be available.
(Airbnb, From Isolation To Connection—Travel in 2021)
- Consumers are 20% more likely to use a travel professional to book their vacations now than before COVID-19. Two in five cite the following reasons:
- The security of a vacation package (41%)
- A travel professional’s up-to-date advice (40%)
(ABTA, Six Trends for Travel in 2021)
- For 40% of travelers, accommodation reviews are more important today than before COVID-19.
(Expedia, What Travelers Want in 2021)
FAQ
What percentage of travelers write hotel reviews?
What’s the average cost of business travel?
How much do Americans spend on airfare?
Why should hotels respond to negative reviews?
Do travelers use social media while on vacation?
Stacking It All Up
There you have it.
A comprehensive list of facts, figures, and stats you can use to get a better picture of how people want to travel in 2025 and beyond.
Let us know in the comments if there are any other travel statistics you’d like to see.
Fair Use Statement
Did you like our infographics? If so, feel free to share them with your audience. Just remember to mention the source and link back to this page.

As a Digital PR specialist and a member of the Society of Professional Journalists (SPJ), Max has 5+ years of writing experience.
Over the course of his career, Max’s work has garnered significant attention, with features in numerous prominent publications such as The New York Times, Forbes, Inc., Business Insider, Fast Company, Entrepreneur, BBC, TechRepublic, Glassdoor, and G2.