While hitting the open road can be exciting, it’s not always smooth sailing.
From traffic jams to high-beam offenders, LOTS of annoyances can make your journey less enjoyable.
So—
At Passport Photo Online, we took the pulse of 880+ people across the US who’d recently taken a road trip to pinpoint exactly what sparks our tempers on long car rides.
Scroll on to check out the results.
Key Takeaways
- America’s biggest road trip annoyances are negligent signalers (66.94%), traffic jams (66.53%), and backseat drivers (65.84%).
- People in the US usually (27.96%) take 2–3 road trips a year.
- The most popular road trip length (35.54%) among Americans is 3–5 days.
- Up to 500 miles (804.6 km) is the longest distance covered by most drivers in one go.
- The Northeast (30.72%) was picked as the region with the most irritating drivers.
The State of Road Tripping in America
Before we get into the specifics, we wanted to ask Americans a few general questions about their road trip experiences.
After all, as a nation, we love to rev our engines and head straight for the horizon. In fact, according to The Vacationer, ~206M Americans planned a car trip in 2022.
So our first question was, “How often do you go on road trips?”
The results are in:
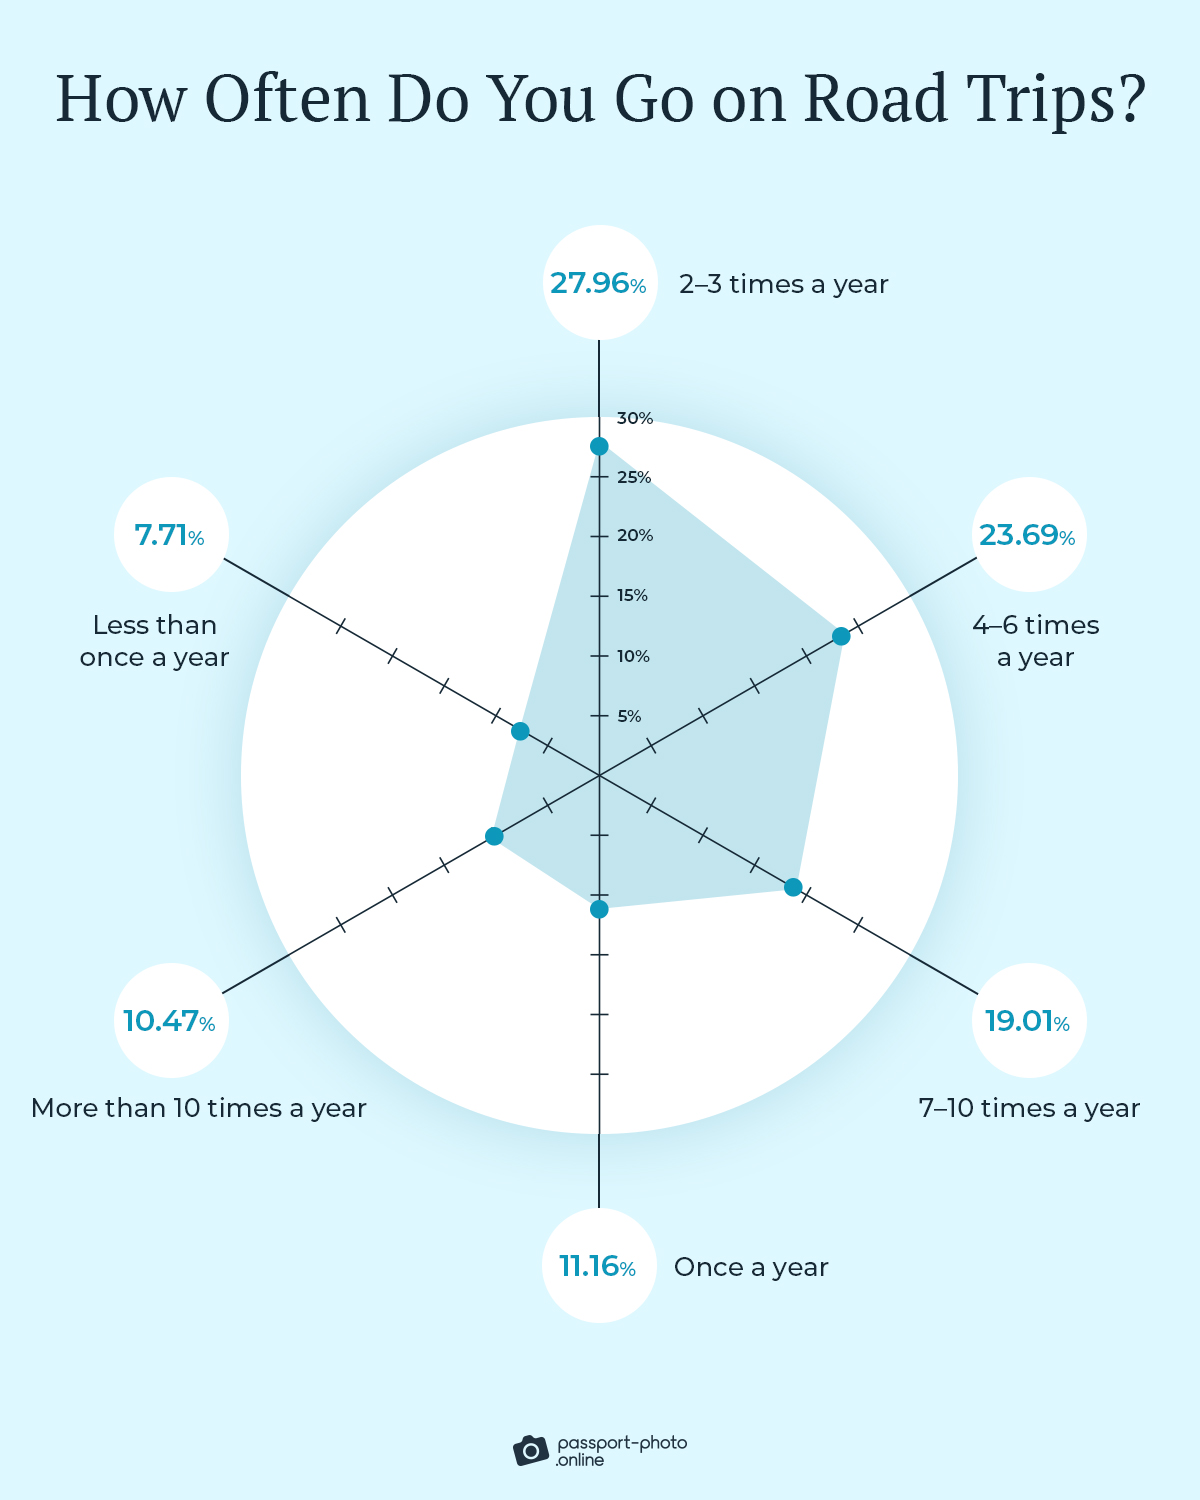
As you can see, most respondents (27.96%) said they usually take 2–3 road trips a year, followed by 4–6 times at 23.69%.
Popping the hood and digging a little deeper, we asked respondents how long their road trips last.
Have a look:
| How Long Do Your Road Trips Last on Average? | Share |
|---|---|
| 3–5 days | 35.54% |
| 1–2 days | 22.59% |
| 6–10 days | 19.97% |
| More than 10 days | 12.95% |
| Less than a day | 8.95% |
The data shows that 3–5 days is Americans’ most popular road trip length (35.54%).
Now—
At this stage, we wanted to kick things up a notch and ask survey takers what’s the longest distance they’d traveled on a single road trip.
Here’s what we found:
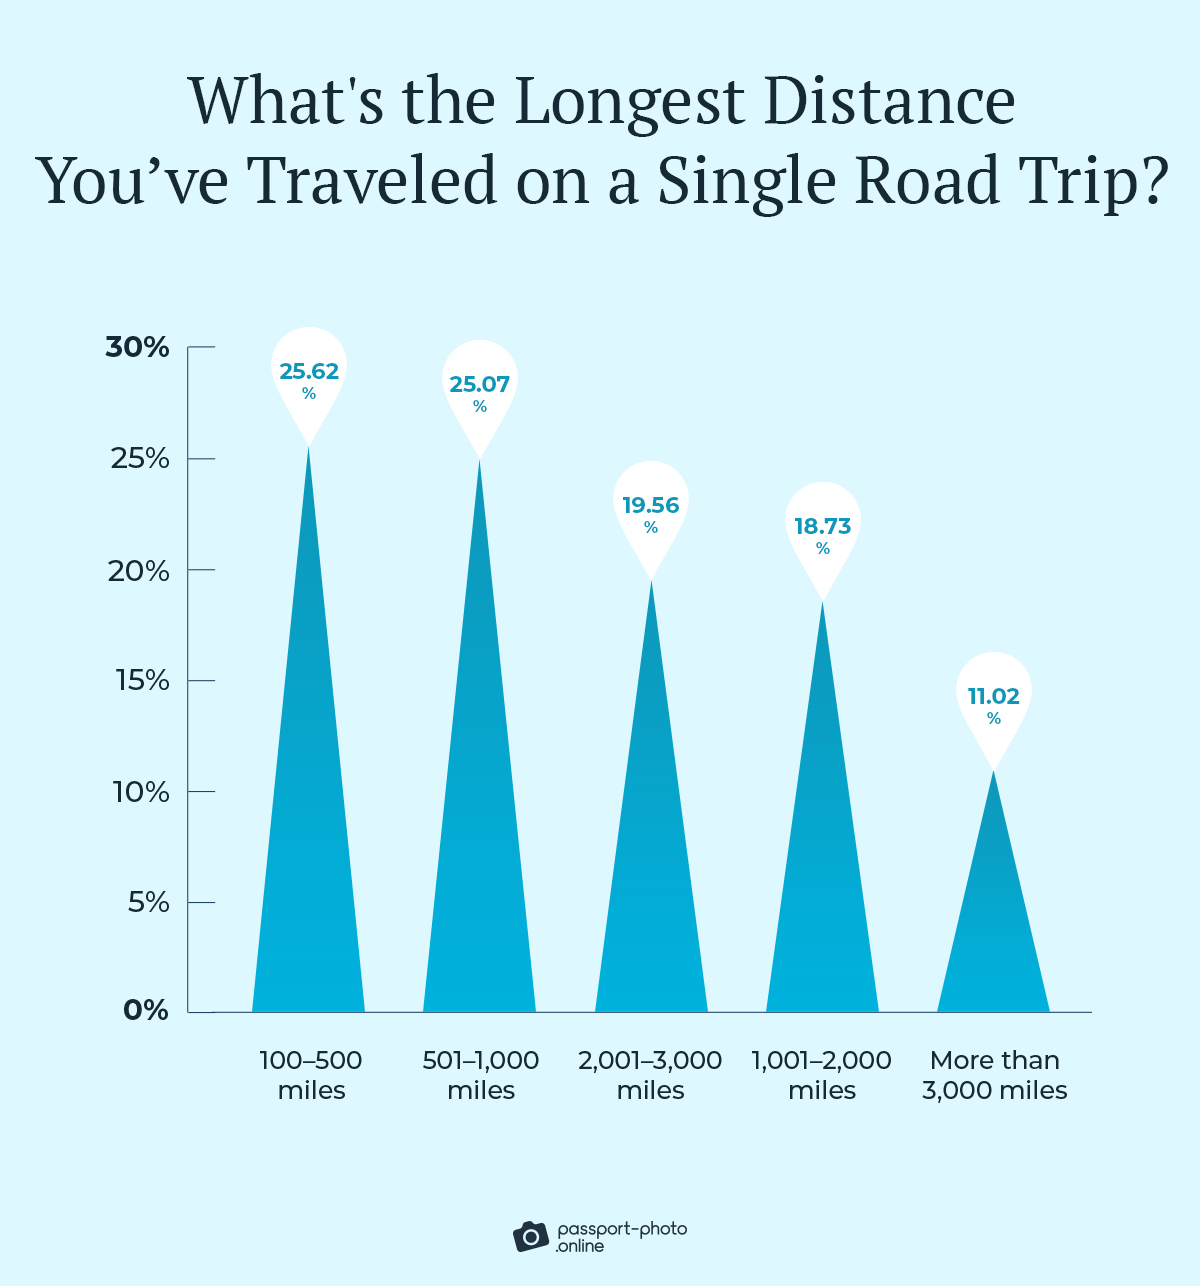
Up to 500 miles (804.6 km) was the most popular answer (25.62%).
Although that doesn’t sound like much, 500 miles is 8.3 hours of driving if you’re going 60 mph (96.5 km/h).
For our final question, we asked Americans a somewhat provocative question. Namely, “In your opinion, which region in the US has the most annoying drivers?”
The results are in:
| Answer | Share |
|---|---|
| Northeast | 30.72% |
| Midwest | 24.1% |
| Southeast | 18.32% |
| Southwest | 17.08% |
| West | 9.78% |
Are you surprised to learn that Northeast drivers took the crown?
Let us know in the comments!
Biggest Road Trip Annoyances
Now that we know more about Americans’ road trip experiences, it’s time to tackle the big question.
Namely, which irritations make us lose our cool on the road.
To do it, we gave respondents a list of common pet peeves divided by category and asked them to rank each from 1–5 (with five being “very annoying”).
The first category? “Travel disruptions.”
Let’s see how Americans voted:
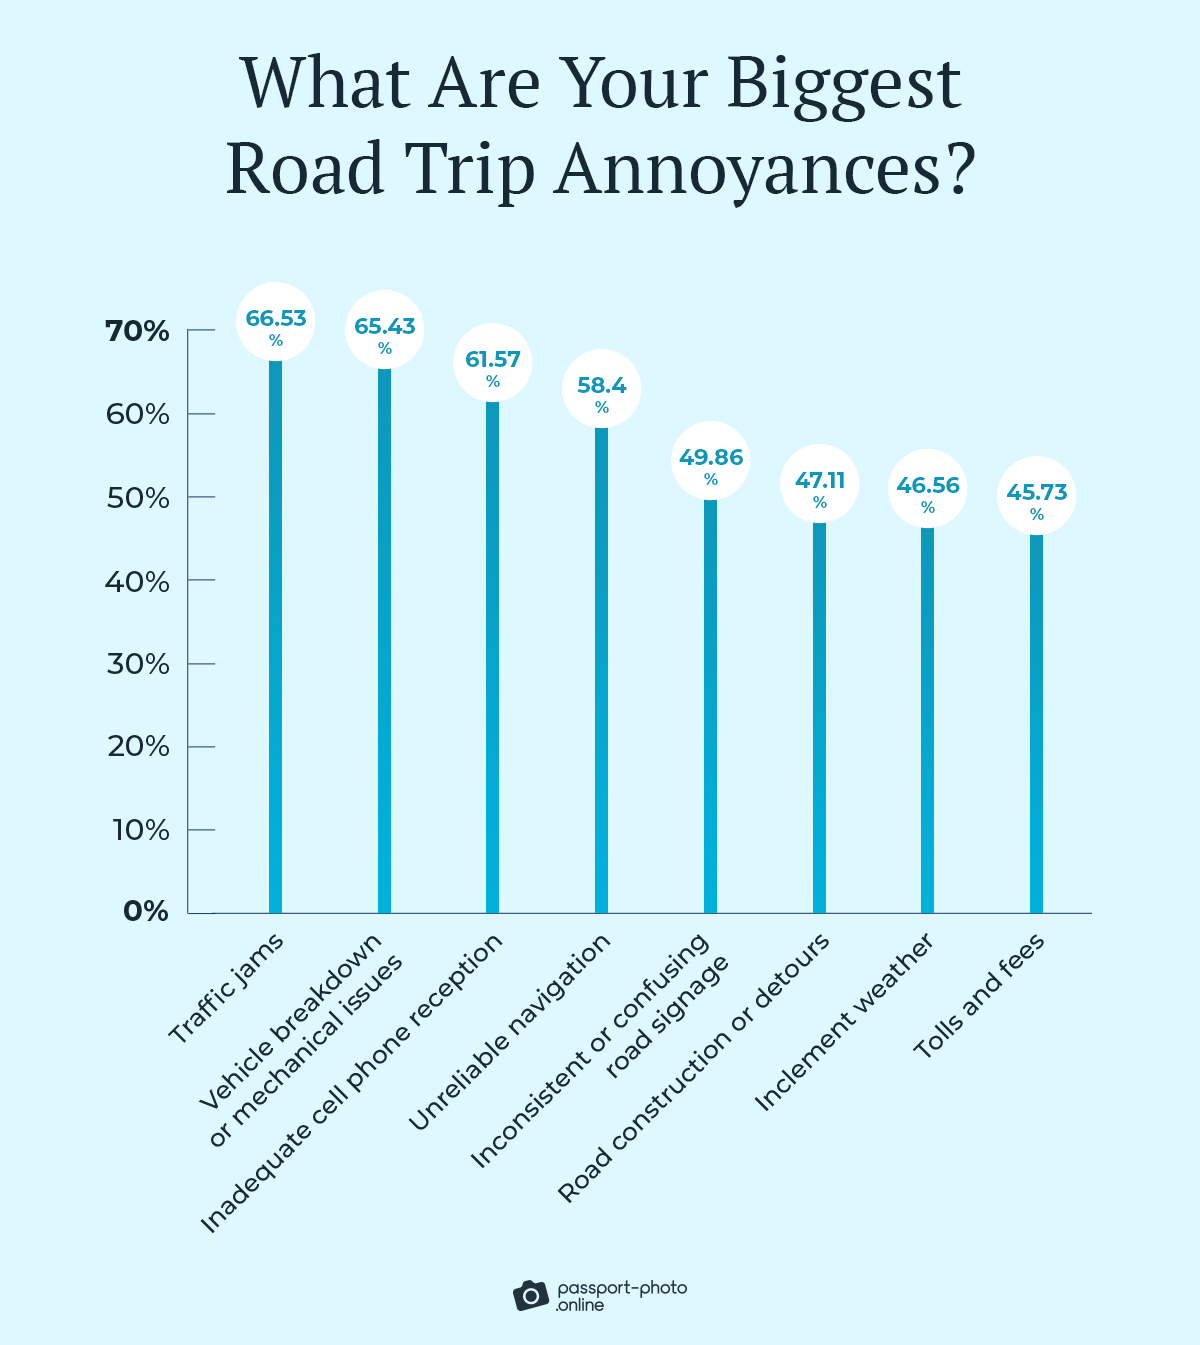
Traffic jams (66.53%) were the biggest annoyance in this category. It’s followed by vehicle breakdown or mechanical issues (65.43%) and inadequate cell phone reception (61.57%).
Moving on, here’s how Americans ranked pet peeves in the “passengers” category.
| Answer | Share |
|---|---|
| Backseat drivers | 65.84% |
| Passengers who constantly change the music | 61.43% |
| Passengers who constantly adjust the temperature | 59.64% |
| Loudly- or excessively-talking passengers | 47.8% |
| Passengers who frequently ask for bathroom breaks, snack stops, or photo opportunities | 44.35% |
The biggest annoyance is backseat drivers at 65.84%.
No surprise there, right?
Finally, let’s see how Americans ranked the “other drivers” category.
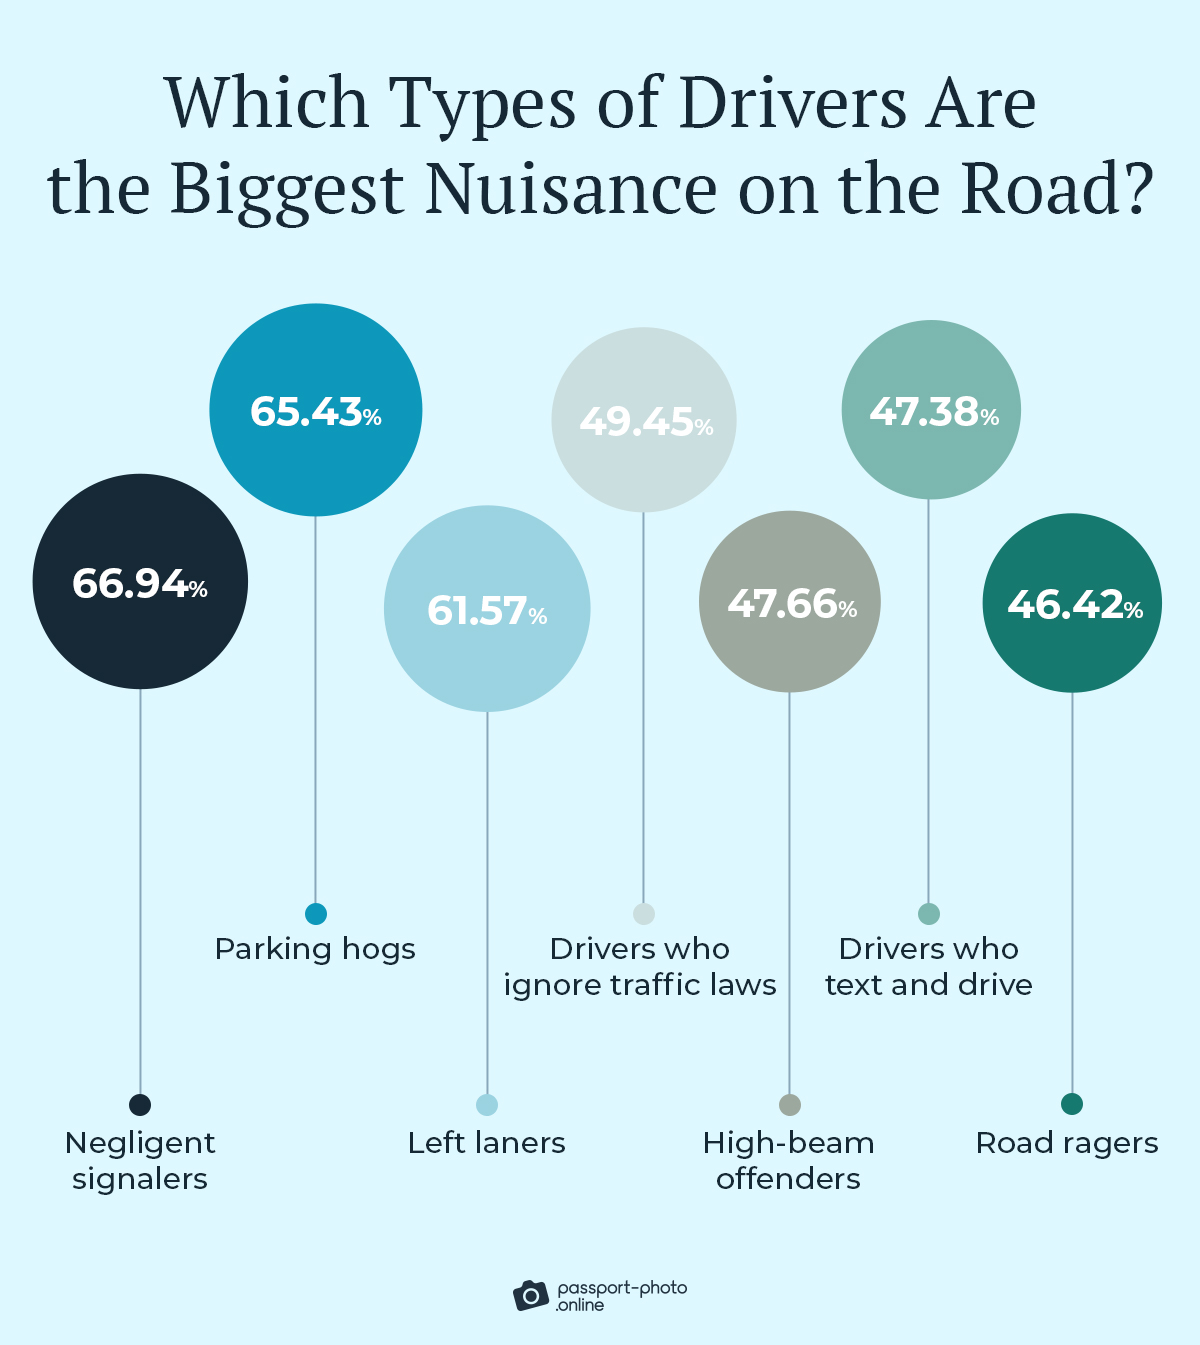
At this stage, we decided to put all the pet peeves we’d discussed together to get a better picture of what Americans find the most vexing on the road.
Take a look at the TOP three that made the cut:
- Negligent signalers: 66.94%
- Traffic jams: 66.53%
- Backseat drivers: 65.84%
Thus, drivers who fail to use turn signals or misuse them are Americans’ #1 annoyance.
So—
The next time you start an engine for a trip, mind those signals!

Do you need passport photos? Find out more:
Stacking It All Up
There you have it!
A comprehensive look at America’s biggest road trip pet peeves.
Now—
What’s your biggest annoyance when you’re out on the open road?
Let us know in the comments below.
Methodology
We conducted an online survey of 881 US respondents who’d gone on a road trip at least once in the past 24 months via a bespoke online polling tool in May 2023.
The respondents were 65.7% male and 34.3% female. 26.2% of respondents were 26 or younger, 59.6% were aged 27–42, 11% were 43–58, and 3.2% were 59 or older.
This survey has a confidence level of 95% and a margin of error of 3%. Given the gender and age makeup of our sample size, the study’s findings are statistically significant for the population at large.
This study was created through multiple research steps, crowdsourcing, and surveying. Data scientists reviewed all survey participants’ responses for quality control. The survey also had an attention-check question.
Fair Use Statement
Did our findings help you learn more about road trip pet peeves? If you believe your audience will be interested in this information, feel free to share it. Just remember to mention the source and link back to this page.
Sources
- The Vacationer, “Summer Travel Survey 2022 — Nearly 81% to Travel, 42% to Travel More than Last Summer, Nearly 51% to Fly on a Plane, 80% to Road Trip”

As a Digital PR specialist and a member of the Society of Professional Journalists (SPJ), Max has 5+ years of writing experience.
Over the course of his career, Max’s work has garnered significant attention, with features in numerous prominent publications such as The New York Times, Forbes, Inc., Business Insider, Fast Company, Entrepreneur, BBC, TechRepublic, Glassdoor, and G2.
