Consider this:
The number of vacation rental hosts in the US grew by 50% in 2021.
That’s because an average host can make an extra $13K annually by listing their spare room or vacation house.
Impressive, huh?
So—
If you want to learn more about the industry, you’re in good company.
At Passport Photo Online, we’ve gathered all the latest statistics, facts, and trends in one easy-to-digest article to help you see where things are heading.
Keep scrolling.
Top 10 Vacation Rental Statistics to Know in 2023
- 700M people globally used vacation rentals in 2022.
- 60M+ Americans stayed in vacation rentals in 2022.
- The US short-term rental industry was worth ~$20B in 2022.
- The vacation rental industry’s compound annual growth rate (CAGR) is over 5%.
- There were +28M vacation rental listings available worldwide as of 2022.
- 45% of US residential properties in 2021 were purchased for vacation rentals.
- Of the 200 most popular cities on vacation rental platforms, 70% have enforced regulations for hosts.
- Airbnb generates 80% of vacation rental traffic in the US.
- The global vacation rental industry earned $82B in revenue in 2022.
- An average 1% rise in short-term rentals triggers a 5% increase in house prices.
General Vacation Rental Industry Statistics
- 1.4M+ vacation properties were available for rental across the US in 2021.
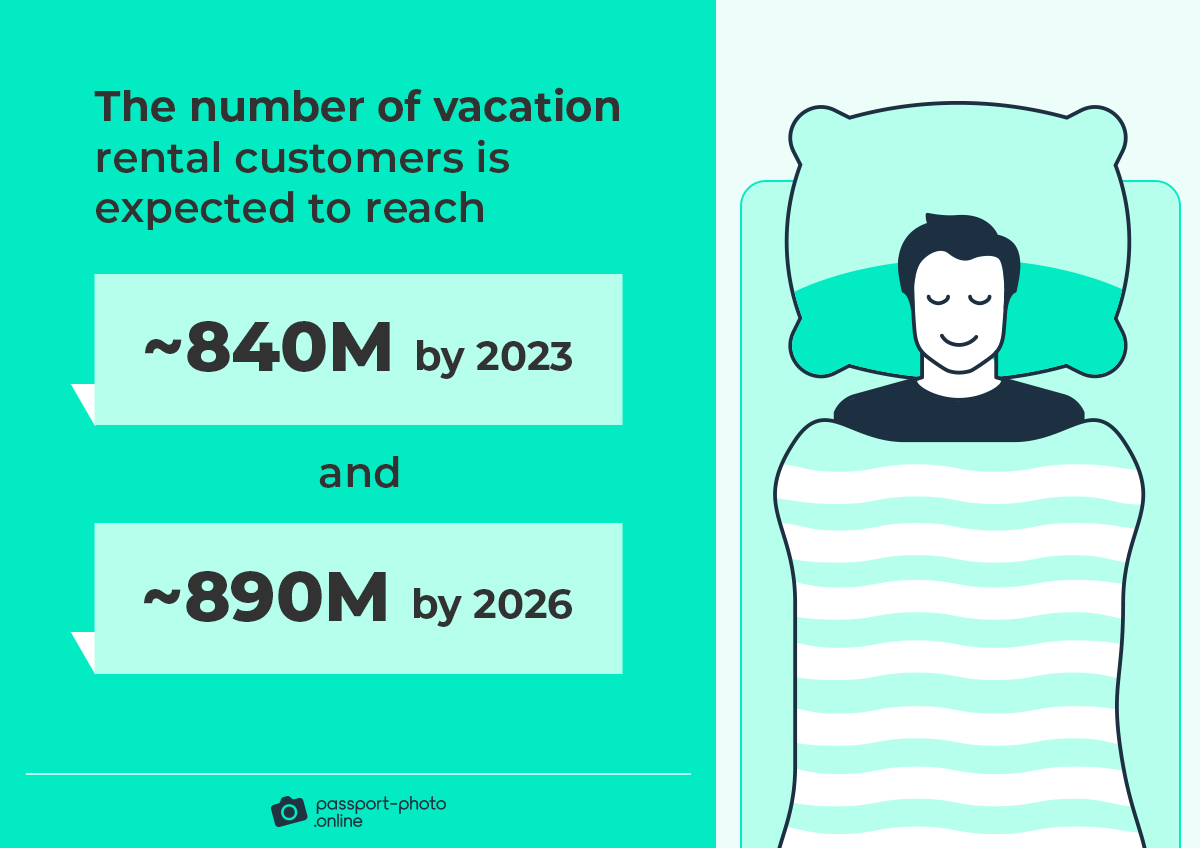
- The number of vacation rental customers is expected to reach ~840M by 2023 and will continue growing to ~890M by 2026.
- Vacation rental occupancy rates in the US averaged 63% in 2021, with a projected decline to 46% in 2022.
- Around 15% of Americans opted for vacation rental options in 2021.
- 18% of US citizens engaged with the vacation rental industry in 2022.
- Airbnb is the most significant player in the vacation rental industry in the US, with 80% of the market share.
| Vacation Rental Platform | Market Share (in North America) |
|---|---|
| Airbnb | 80% |
| HomeAway | 10% |
| Others | 10% |
- There are over 140K professional vacation rental management companies worldwide.
- 25K vacation rental management businesses operate in the US alone.
- Vacation rental management organizations administer an average of 79 listings.
- Millennials and younger generations will represent 75% of all vacation rental consumers by 2025.
- The median age of the vacation rental customer is 41.
| Age Group | Share in the Vacation Rental Industry |
|---|---|
| 25–34 | 31% |
| 35–44 | 26% |
| 45–54 | 17% |
| 18–24 | 16% |
| 55–64 | 10% |
Vacation Rental Market Size
- The vacation rental industry earned $82B in global revenue in 2022.
- The US vacation rental market reached $19B in 2022.
- 60M+ Americans used short-term rental options in 2022.
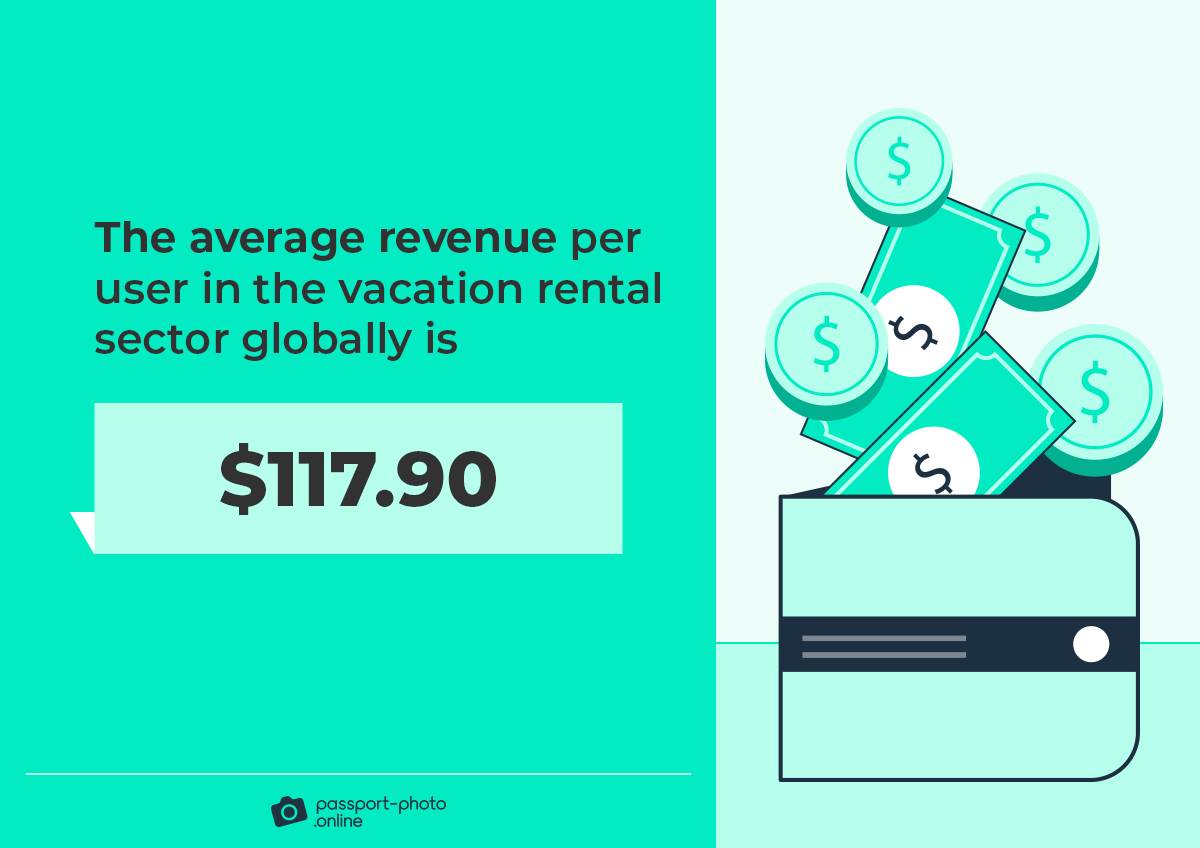
- The average revenue per user in the vacation rental sector globally is $117.90.
- Each American tourist accounts for $305 of the vacation rental industry’s revenue.
- Vacation rental hosts from rural areas in the US earned ~$3.5B in 2021.
| Countries with the Highest Rental Industry Incomes | Generated Revenue (in Q1 and Q2, 2022) |
|---|---|
| United States | 18.6B |
| China | 9.6B |
| United Kingdom | 4.1B |
| Germany | 3.9B |
| France | 3.9B |
Vacation Rental Grows in Demand and Supply
- The vacation rental demand in the US grew by 22% in 2021.
- 138M nights were booked in vacation rentals in the US in 2022.
- The number of vacation rental listings in the US grew from 1.4M to 1.5M in 2022.
- The supply of vacation rental listings grows 23% year-over-year (YoY).
- Over 8K new towns worldwide have become available for vacation rental tourists since 2020.
- There are over 100K cities internationally on Airbnb alone with available vacation rentals.
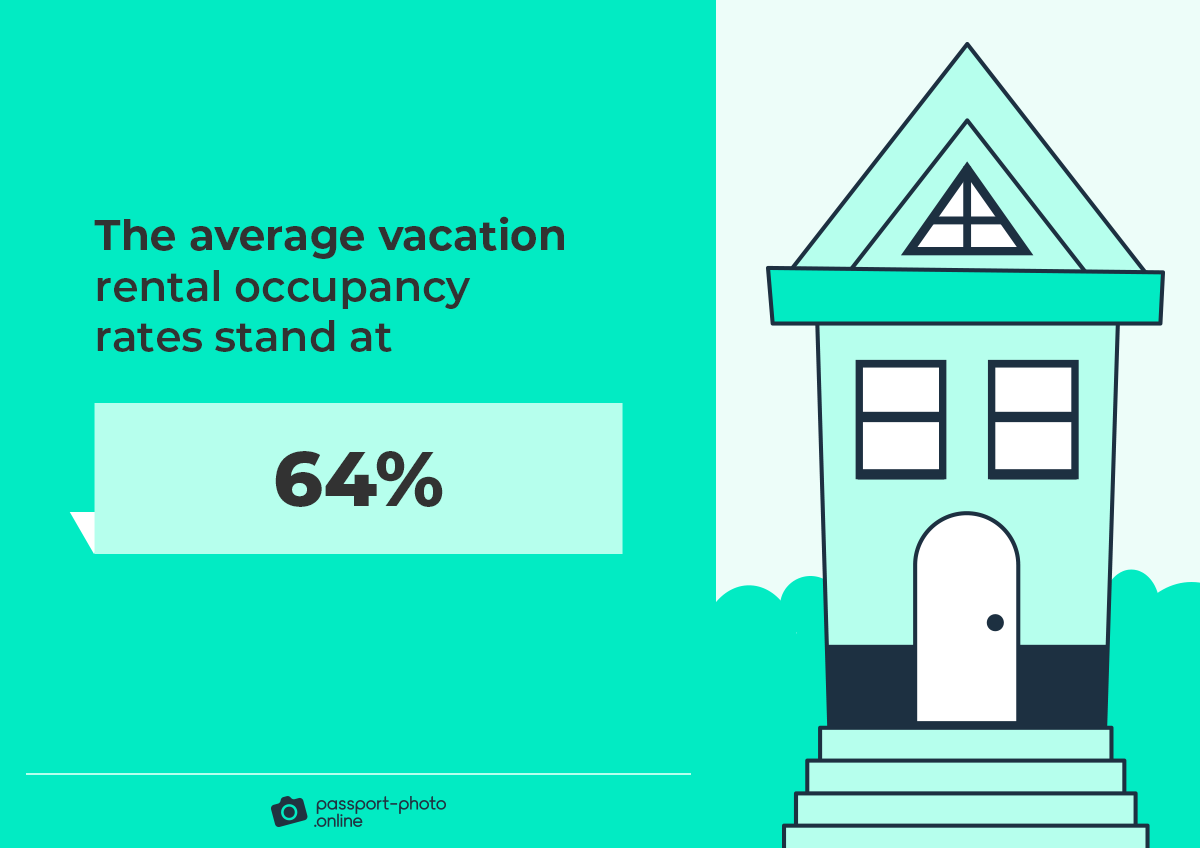
- The average vacation rental occupancy rates stand at 64% (as of 2022).
- The average daily rate of short-term rentals in the US grew by ~12% in 2021.
- Short-term listings in the US earned 20% more in 2021 than in 2020.
- In New York, over 15K houses are used for vacation rentals, whereas in Paris, that number stands at 25K.

Looking for passport photos? Discover more information:
Vacation Rental Trends
- In 2021, the average short-term rental price per night was $137 globally. In North America, the rate stood at $208, followed by Europe ($114) and Asia-Pacific ($104).
- In the US alone, a night in a vacation rental in 2021 cost an average of $216.
- Arizona is the most expensive US state, with an average vacation rental price of $287 per night.
- In Austin, TX, vacation tourists have to pay the most for a night: $400+.
- The cost for a night at a vacation rental rose by ~25% from 2020 to 2021 across all states.
- Arizona noticed the highest spike in per-night rates, with a 78% increase from 2020 to 2021. In Tennessee, prices rose by 58%, followed by Pennsylvania (39%).
- Vacation rental prices barely moved from 2020 to 2021 in Utah, with a modest 3% increase, followed by Wyoming (7%) and Maine (14%).
| Top Cities with the Growing Supply of Vacation Rentals | Year-Over-Year Increase In Available Listings |
|---|---|
| Houston, TX | +49% |
| Phoenix, AZ | +46% |
| San Antonio, TX | +45% |
| Las Vegas, NV | +41% |
| Dallas, TX | +39% |
- Bodrum, Turkey, was the #1 destination in 2022 for vacation rental travelers worldwide.
- For US vacation rental travelers, Venice was the most desirable international destination in the summer of 2022.
- July is the most popular month for vacation rentals in the US, with 23M stays in 2022.
- Sevierville, Tennessee, has the highest median earnings for hosts in the US: over $40K.
- Vacation rental traffic in rural areas in the US grew by 110% in 2021.
- Southern parts of the US noticed the most significant spike in short-term rental listings in 2021.
| Vacation Rental Type | Annual Growth Rate in the US |
|---|---|
| Tiny House | +27% |
| Nature lodge | +25% |
| Bus | +25% |
| Hut | +18% |
| Dome house | +17% |
- Nearly 60% of short-term travelers in 2022 booked their stays 2–5 months in advance. In 2019, most would book less than two months in advance.
- An average trip in 2022 lasted 5–7 days. In 2021, it was 3–4 days.
- Half of vacation rental tourists consider a flexible cancellation policy essential.
- Relaxation and exploration are the two most popular activities for vacation rental customers, scoring 61% and 58%, respectively.
- Campers/RVs are the most popular short-term rental listings in the US:
| Vacation Rental Type | Share of Listings in North America |
|---|---|
| Camper/RV | 30% |
| Farm stay | 26% |
| Tiny House | 22% |
| Tent | 10% |
| Nature lodge | 4% |
Families vs. Vacation Rental
- 50% of families say they let children choose vacation rental destinations to some extent.
- Over 30% of families are OK with taking other children for a short-term retreat.
- 43% of parents are fine with kids skipping school for vacation.
- Over 60% of parents don’t allow children to use mobile devices while vacationing.
- 40% more people looked for pet-friendly vacation rentals in 2021 compared to 2020.
- Vacation rental bookings longer than 21 days grew by 68% between 2020 and 2021.
- 60% of vacation rental tourists now plan their vacation earlier after COVID-19.
- 59% of families prefer driving to vacation rental destinations over flying.
Higher Earnings Make People Turn To Vacation Rental
- A typical US host on Airbnb (market leader) earned $13K in 2021.
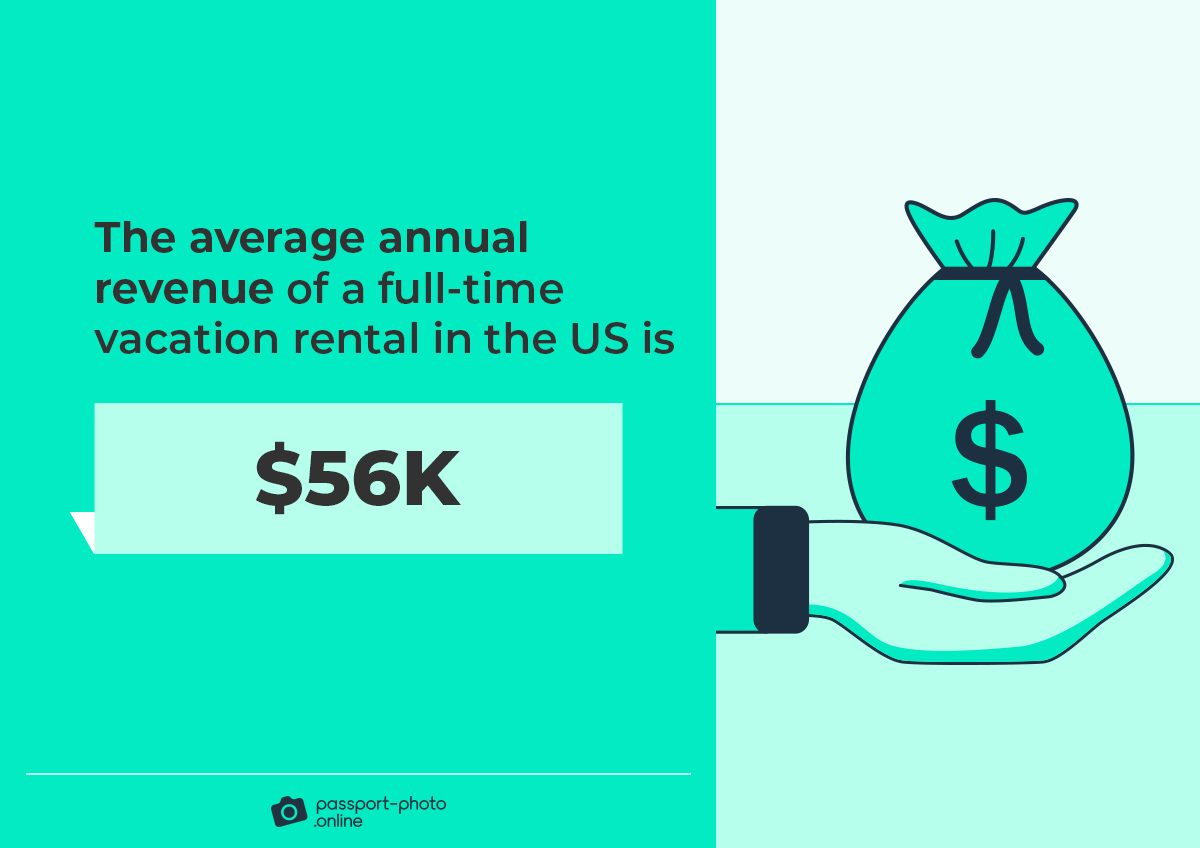
- The average annual revenue of a full-time vacation rental in the US is $56K.
- The earnings of Airbnb hosts have grown by 85% since 2019.
- The total revenues of new hosts on Airbnb reached over $1.8B in 2021.
- Chosen countries where inflation gave rise to vacation rental listings:
| Country | Inflation Rate | Increase in New Hosts |
|---|---|---|
| Canada | 8% | +100% |
| Spain | 10% | +70% |
| United States | 9% | +50% |
- The number of new Airbnb hosts grew by 50% in 2022.
- 40% of hosts on Airbnb admit that listing their property helped them keep the estate amid increasing prices, and 20% say it helped them avoid eviction.
| Reasons to Become a Vacation Rental Host | Share of Hosts That Agree |
|---|---|
| Make ends meet | 40% |
| Earn extra spending money | 40% |
| Cover the rising cost of living | 35% |
The Airbnb Effect
- An average 1% increase in vacation rental properties ups housing prices in the area by over 5%.
- The price of a home may double if vacation rental houses make up 14% of the total properties in a neighborhood.
- Vacation rentals account for 25% of all houses in some parts of the UK.
- In some Australian regions, short-term rentals outnumber standard long-term rentals to locals 40 to one.
- In Spain, some districts saw a 50% spike in private rental prices due to the growing number of vacation rental options.
- In Barcelona, 65% of vacation rental listings are made for commercial use (e.g., as investments), whereas only 35% are home-sharers.
| Property Characteristics | The Airbnb Effect on House Prices |
|---|---|
| Location in Venice (one of LA’s districts) | 38% |
| 2.5 km proximity to Hollywood | 20% |
| Location in Malibu | 17% |
| 2.5 km proximity to a beach | 5% |
Cities’ Response to Vacation Rental Listings
- Of the 200 most popular cities on vacation rental platforms, 70% have enforced regulations for hosts.
| Top 5 Cities Where Vacation Rental Is Strictly Restricted |
|---|
| Paris |
| Miami |
| Barcelona |
| Amsterdam |
| Santa Monica |
- Paris introduced a 120-night limit on entire-house listings and made platforms like Airbnb freeze offers that go over it.
- Barcelona introduced a fixed number of vacation rental listings per zone.
- New York banned unhosted short-term rentals (renting a place where the host doesn’t live).
- San Francisco made it obligatory for vacation rental hosts to acquire a permit, allowing only 90 nights per year for a property to be listed.
- In Amsterdam, a house can be listed on vacation rental sites for 30 nights a year.
- In Berlin, homeowners may list their properties for up to 90 nights a year.
- In Vienna, all residents must give their permission to have a vacation rental listing in their building.
- In Arizona, authorities offer a $10K bonus for hosts to rent to locals.
Short-Term Rentals Recovered Swiftly after COVID-19
- Vacation rental industry revenues worldwide nosedived by 43% in 2020, reaching $47B.
- In the US, the short-term rental industry suffered a 30% decrease in 2020.
- Due to the pandemic, 15% of US employees in the vacation rental segment lost their jobs.
- The number of vacation rental industry clients went from 60M to 40M in 2020.
- Since the pandemic-induced slump in 2020, the US vacation rental industry has seen a 60% growth.
- Although there were 10% fewer listings available in 2022, short-term rentals generated 40% more revenue than before the COVID-19 pandemic.
- China became the vacation rental market leader in 2020, with 76M customers, outperforming the US with 40M customers.
Stacking It All Up
There you have it.
A comprehensive list of vacation rental industry statistics, facts, and trends to help you stay on top of things.
Are there any other stats you’d like to see? Or perhaps you’re curious about a particular statistic or fact you stumbled upon in our roundup?
Let us know in the comments!
FAQ
What’s a vacation rental?
What’s the vacation rental market growth rate?
What’s a good profit margin for a vacation rental?
Are Airbnb listings profitable?
How many vacation rentals are there in the United States?
How big is the vacation rental industry?
How many people use a vacation rental?
Fair Use Statement
Did you like our infographics? If so, feel free to share them with your audience. Just remember to mention the source and link back to this page.
Sources
- Airbnb News, “Airbnb 2022 Summer Release Highlights”
- Airbnb News, “Hosts in Rural America Earned More than $3.5 Billion in 2021”
- Airbnb News, “New Survey: Hosts Use Income to Cover Rising Costs, Guests Find New Travel Spots”
- Airbnb News, “While Inflation in the US Rises, New Hosts Grow in Q2 2022”
- AirDNA, “The 2022 Vacation Rental Outlook Report for Destination Marketers”
- AirDNA, “U.S. Market Review: Record Summer Ends on a High”
- AllTheRooms, “Average Airbnb Prices By City: How Much Should You Charge For Your Airbnb? [2022]”
- AllTheRooms, “Industry Report July 2022”
- BBC News, “Berlin Cracks Down on Airbnb Rentals”
- Cox M., Haar K., “How Short-Term Rental Platforms Like Airbnb Fail To Cooperate with Cities and the Need for Strong Regulations to Protect Housing”
- Evolve, “2022 Travel Trends Forecast”
- Grand View Research, “Vacation Rental Market”
- Hostfully, “2021 Vacation Rental Industry State Report”
- Investopedia, “Top Cities Where Airbnb Is Legal or Illegal”
- Koster H., van Ommeren J., Volkhausen N., “Short-Term Rentals and the Housing Market: Quasi-Experimental Evidence from Airbnb in Los Angeles”
- National Association of Realtors, “Airbnb, Predictive Analytics to Have Large Impact on Real Estate in 2022, Expert Says”
- New York Post, “Arizona City to Pay Airbnb Hosts $10K to Rent Longer-Term to Locals”
- Statista, “Most Popular Types of Summer Vacation Accommodation for Travelers in the United States as of March 2022”
- Statista, “Number of Users in Selected Countries in the Vacation Rentals Market in 2020”
- Statista, “Vacation Rentals in the United States”
- Statista, “Vacation Rentals Worldwide”
- The Guardian, “Revealed: The Areas in the UK with One Airbnb for Every Four Homes”
- The Guardian, “Soaring Rents and Noisy Parties: How Airbnb Is Forcing Out Barcelona Locals”
- The West Australian, “Housing Crisis: Airbnb Listings Outnumber Vacant Rentals by More than 40 to One in Many Regional WA Towns”
- Vrbo, “The 2022 Vrbo Trend Report”

Adam is an SEO & Digital PR writer with a child’s curiosity about the surrounding world. His superpower to dig out juicy facts got him citations in Forbes, Social Media Today, and 90+ other news outlets. Adam enjoys snapping pictures and won the national Huawei Next Image Award.
