


The father of all social networks.
Founded in 2004 by Mark Zuckerberg (with his roommates), Facebook has grown to ~72K employees in less than 20 years.
But—
How much do you really know about Facebook?
At Passport Photo Online, we’ve compiled the most relevant and up-to-date Facebook statistics and facts to help you better understand where this social media giant is headed.
Scroll on.
Top 10 Facebook Stats and Facts to Know in 2026
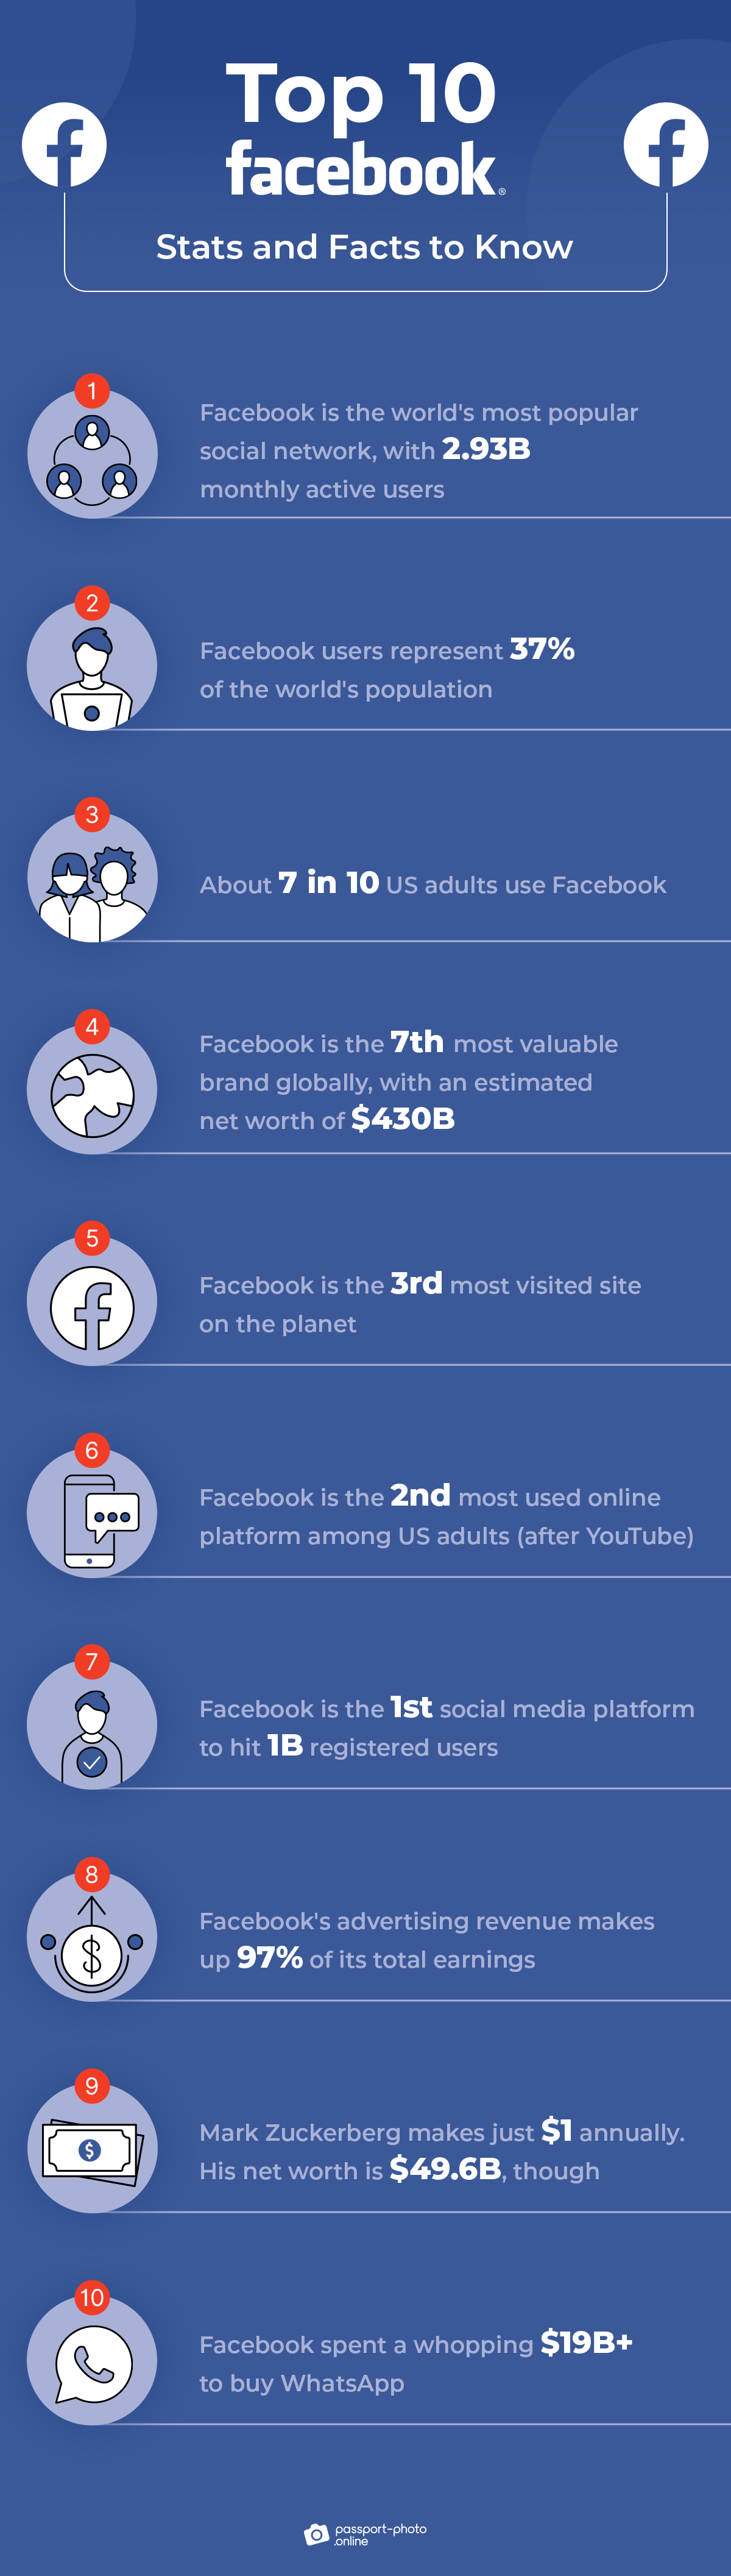
- Facebook is the world’s most popular social network, with 2.93B monthly active users (MAUs).
- Facebook users represent 37% of the world’s population.
- About seven in 10 US adults use Facebook.
- Facebook is the 7th most valuable brand globally, with an estimated net worth of $430B.
- Facebook is the 3rd most visited site on the planet.
- Facebook is the 2nd most used online platform among US adults (after YouTube).
- Facebook is the 1st social media platform to hit 1B registered users.
- Facebook’s advertising revenue makes up 97% of its total earnings.
- Mark Zuckerberg makes just $1 annually. His net worth is $49.6B, though.
- Facebook spent a whopping $19B+ to buy WhatsApp.

Looking for passport photos? Discover more information:
General Facebook Statistics
- Over 98% of Facebook users access the social network from mobile devices.
- Facebook is available in 100+ languages.
- At least eight of Facebook’s leading executive officers earn $20M+ annually.
- Facebook has been banned in China since 2009.
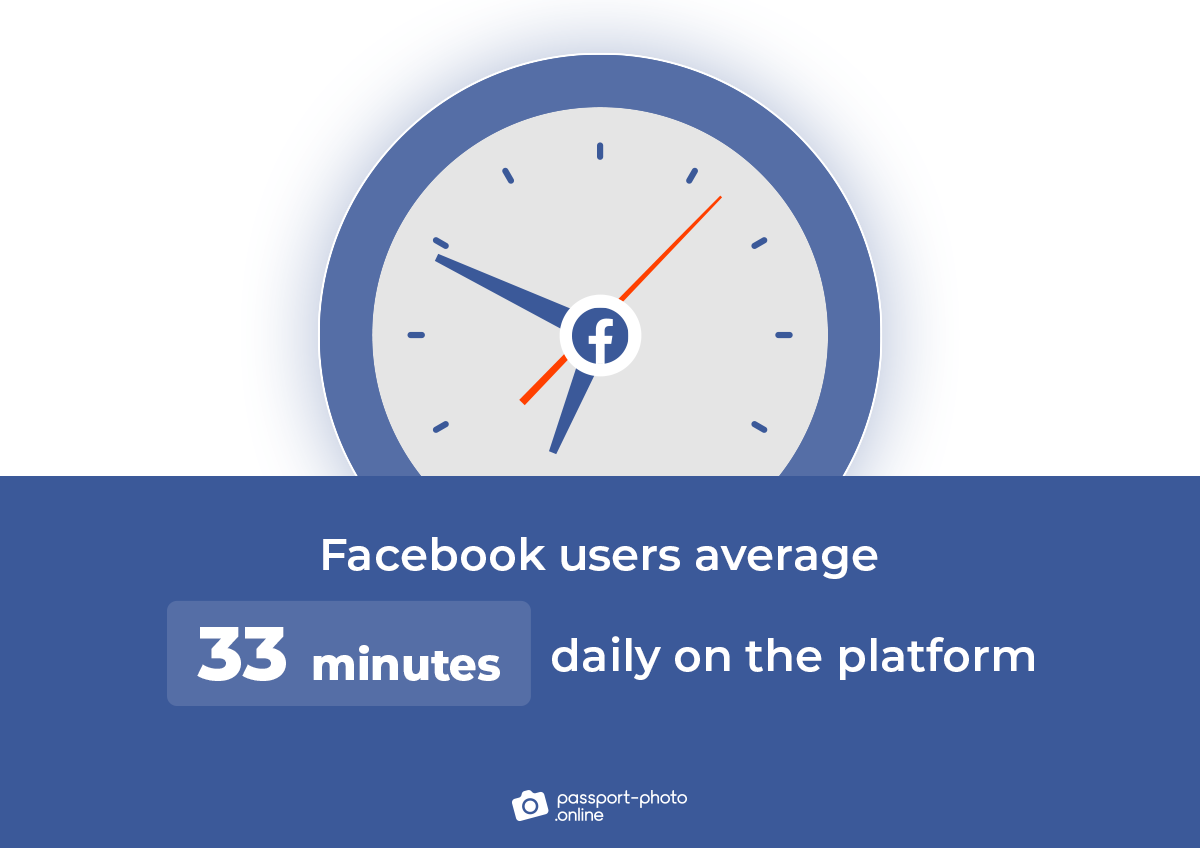
- Facebook users average 33 minutes daily on the platform (more than on any other social media).
- An average user spends 16+ hours on Facebook monthly.
- Seven in 10 users access the Facebook app daily, and 50% go on Facebook several times a day.
- The Facebook engagement rates on posts are higher between Tuesday and Friday, particularly during early morning hours (3–10 AM) and noon.
- Facebook posts uploaded between 9 PM and 2 AM get the lowest engagement.
- The worst days to post on Facebook are Saturdays and Sundays.
- The average adult user on Facebook likes 11 posts, comments on five, and re-shares one every month.
- The most engaging Facebook content is humorous, inspirational, or valuable.
- The average Facebook engagement rate is 0.12% higher for photos than any other content type.
- Women are 75% more likely than men to comment on a Facebook post.
- One in three US adults regularly uses Facebook as a news source.
- Photos are Facebook’s most popular content type (35.6%), followed by videos (15.1%).
- ~15% of the content on Facebook users’ feeds comes from non-followed accounts.
- 300M users post Facebook Stories, and 500M view them daily.
- Facebook users spend 26% of their time engaging with Reels.
- dailywire.com is the most prominent web publisher on Facebook, enjoying 36.59M interactions, including likes, shares, and comments.
- Facebook Marketplace receives 1B+ monthly visitors.
- There are 250M Facebook Shops (as of 2021).
- 1.8B+ people use Facebook groups every month.
The Number of Facebook Users (+Usage Rates)
- With ~329M users, India has the most Facebook accounts worldwide, followed by the US, Indonesia, and Brazil:
| Country | Number of Facebook Users (in Millions) |
|---|---|
| India | 329.65 |
| US | 179.65 |
| Indonesia | 129.85 |
| Brazil | 116 |
| México | 89.7 |
| Philippines | 82.85 |
| Vietnam | 70.4 |
| Thailand | 50.05 |
| Egypt | 44.7 |
| Bangladesh | 44.7 |
- Facebook has 1.97B daily active users (DAUs). That’s 60M more DAUs than in 2021 (3.1% year-over-year growth).
- Facebook’s user growth rate was 0.8% in 2021 compared to 3.3% in 2020. This decrease may be due to the growing popularity of other platforms, such as TikTok or Discord.
- There are 264M Facebook monthly active users (MAUs) in North America.
- 407M Facebook MAUs come from Europe.
- Asia-Pacific has the highest number of MAUs: 1.28B.
- North America has the highest active usage rate worldwide, with 82.3% of the population using Facebook.
- In contrast, Africa and Asia have the lowest active usage rates, at 20.83% and 24.8, respectively.
Facebook Demographics
- The dominant age group on Facebook in the US is users between 25 and 34. This cohort constitutes 31% of all users.
- The smallest demographic on Facebook is people aged 65 and up (4.8%), followed by minors (5.6%).
- The number of teenage Facebook users (aged 13–17) went from 71% in 2015 to 51% in 2018.
- US teens whose families aren’t well off are more likely to use Facebook than those with an annual household income of $75K+ (70% vs. 36%).
- Black people (74%) and Hispanics (72%) are more likely to use Facebook than Whites (67%) in the US.
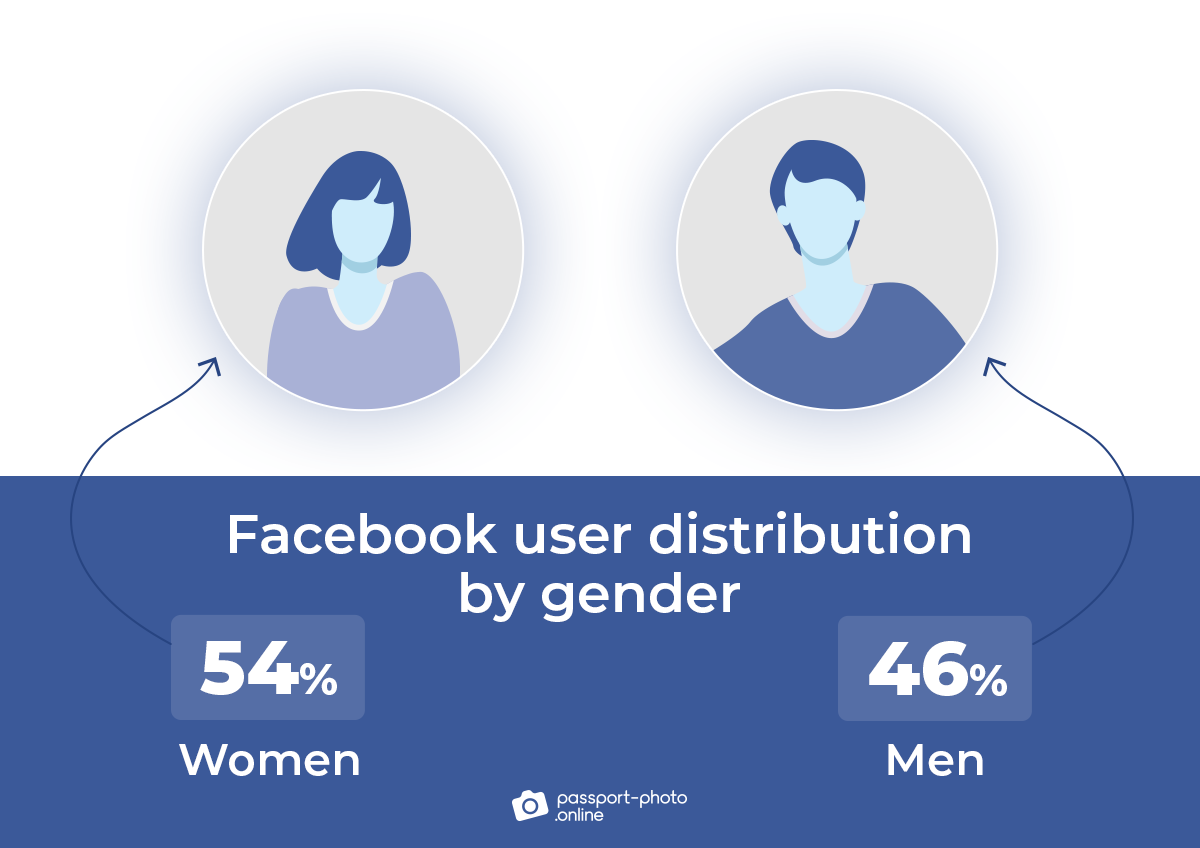
- 54% of Facebook audiences in the US are female, and 46% of users are male.
- 73% of internet users with a college degree use Facebook.
- 70% of those who make over $75K annually are on Facebook.
- Democrats are 3% more likely to use Facebook than those who identify as Republicans.
How Americans Feel about Facebook
- 93% of US citizens are familiar with Facebook.
- Over half of Americans (55%) have a favorable opinion of Facebook.
- 61% of people in North America don’t consider Facebook a reliable source of political news.
- 54% of Americans don’t have a positive attitude toward Mark Zuckerberg.
- 72% of US users don’t trust Facebook’s data policy.
Key Facebook Statistics for Marketers
- 93% of companies use Facebook to promote their business.
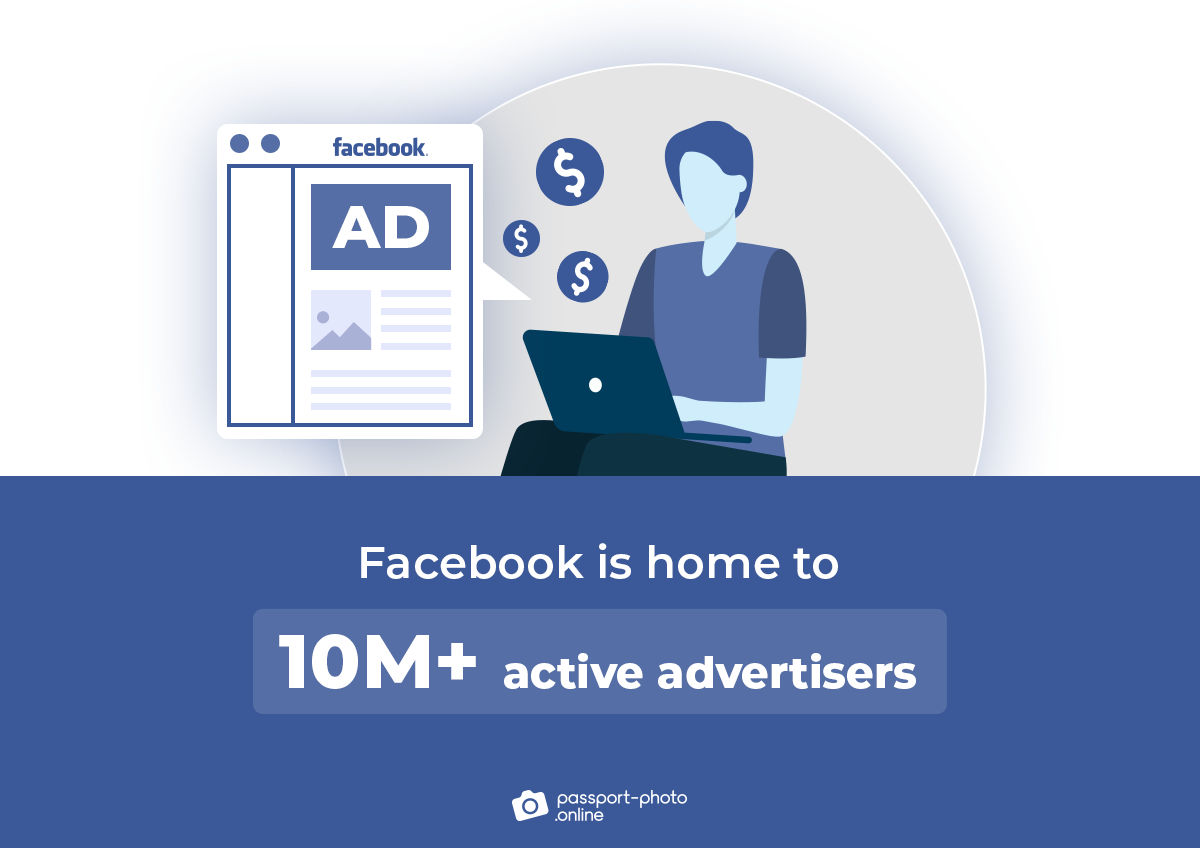
- Facebook is home to 10M+ active advertisers.
- 47% of marketers plan to use Facebook more in the future.
- 35% of marketers believe their past Facebook influencer campaigns were a success.
- Facebook is the most profitable social ad platform, according to six in 10 marketers.
- Most marketers agree that Facebook has the highest ROI of all social media platforms.
Facebook Advertising
- Facebook ads have an average cost per click (CPC) of $1.72, an average click-through rate (CTR) of 0.90%, and an ad conversion rate of 9.21%.
- The potential audience reach for a Facebook ad is 2.1B+.
- Mongolia, Libya, and the Philippines have the highest Facebook ad reach.
- 18.3% of US adults purchased something on Facebook in 2021.
- 62% of users worldwide became more interested in a brand after learning about its products or services via Facebook Stories.
- A Facebook user typically clicks on 12 advertisements monthly.
- Women are 40% more likely than men to click on ads.
- Users between 45 and 64 are likelier to click on an ad than any other age group.
- The least likely group to click on ads is males aged 18–24.
- Facebook is more likely to influence women’s purchasing decisions (56%) than men’s (45%).
- 52% of internet users are more likely to buy from a company they follow on Facebook than on all other social media platforms combined.
Facebook Revenue
- Facebook generated $117B in revenue in 2021. It’s 37% more than the previous year’s revenue ($85B).
- Facebook lost 21% of its value between 2019 and 2020. That’s more than any other company during this period.
| Year | Facebook Revenue (in Billions) |
|---|---|
| 2021 | 117.9 |
| 2020 | 85.9 |
| 2019 | 70.6 |
| 2018 | 55.8 |
| 2017 | 40.6 |
| 2016 | 27.6 |
| 2015 | 17.9 |
| 2014 | 12.4 |
| 2013 | 7.8 |
| 2012 | 5 |
- Facebook earned $114B in 2021 from advertising. That’s 97% of its total revenue.
- Facebook’s total annual revenues went from $5B to $120B in only 14 years.
- Facebook generated $1B in annual revenue from Reels ads.
- $40.5B of Facebook’s 2021 revenue came from North America.
- The Facebook app helped generate nearly $60B of revenue in 2021.
- Facebook’s total expenses amounted to $71B in 2021. Most notably, $24.65B was spent on research and development.
- Facebook’s annual net income went from $37M in 2010 to $39B in 2021.
- The Facebook company had a net income of $6.7B in the 2nd quarter of 2022. It’s only 64% of what was generated this same quarter last year.
- Facebook spent $20.5B in the 2nd quarter of 2022, an increase of 22%, mainly due to more personnel and investment in marketing campaigns.
- Facebook’s average revenue per user (ARPU) is $9.82. But this number varies greatly depending on the region:
| Region | Facebook’s Average Revenue per User (ARPU) |
|---|---|
| North America | $50.25 |
| Europe | $15.64 |
| Asia-Pacific | $4.54 |
| Rest of the world | $3.35 |
- Facebook accounts for 25.2% of Meta’s digital ad revenue share.
Facebook and Messenger App
- Facebook and Messenger rank 2nd (57%) and 7th (47%), respectively, regarding apps with the highest mobile audience reach in the US.
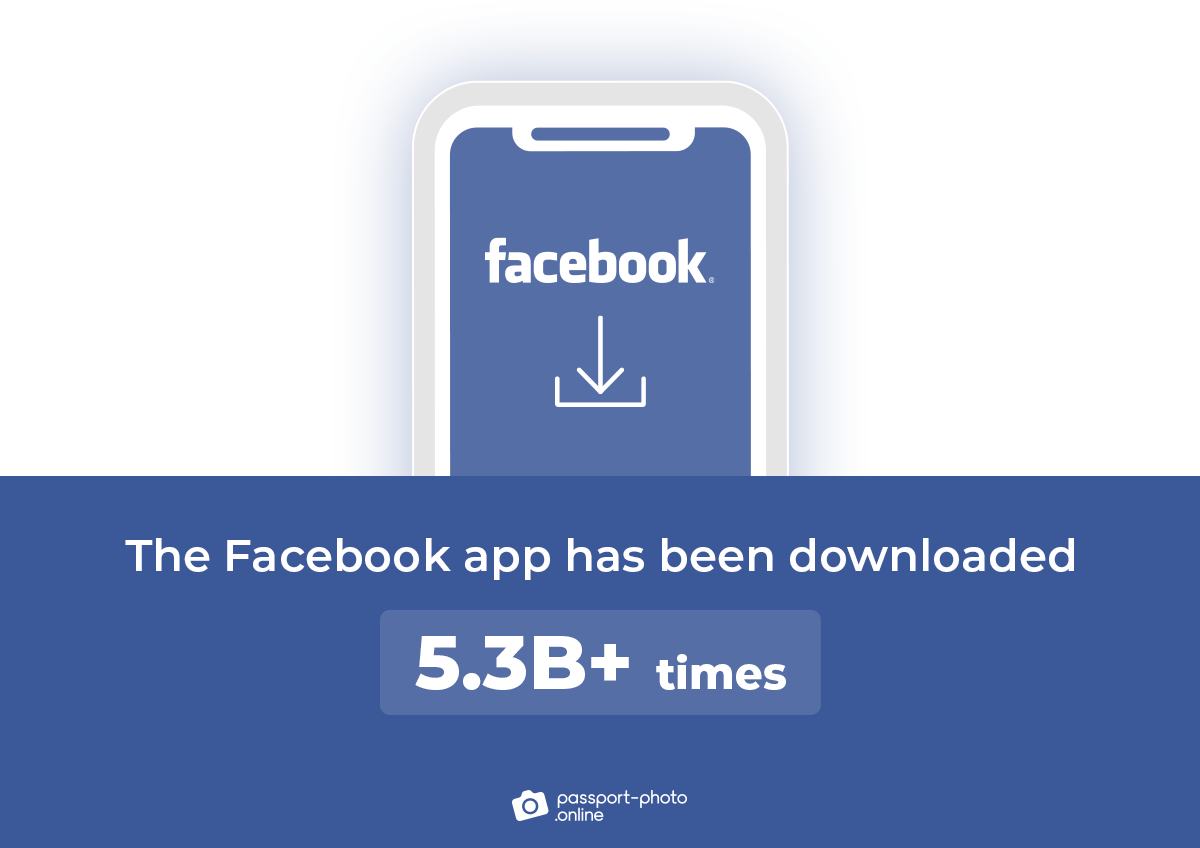
- The Facebook app had been downloaded 5.3B+ times as of 2022.
- Facebook has been the 3rd most downloaded app in the App Store and Google Play since 2014. Facebook Messenger ranks 2nd.
- Facebook Messenger has been downloaded 5.4B+ times since 2014.
- 43% of Facebook Messenger’s downloads come from Asia.
- Facebook Messenger has ~184M US users.
Facebook Videos
- Videos make up over 15.5% of all Facebook content.
- The most successful visual content on Facebook is in-feed videos. Over half of users (51%) like it more than Facebook Live (24%) or Watch (23%).
- Facebook’s live video views have increased by 55% since 2021, accounting for 18.8% of all videos on the site.
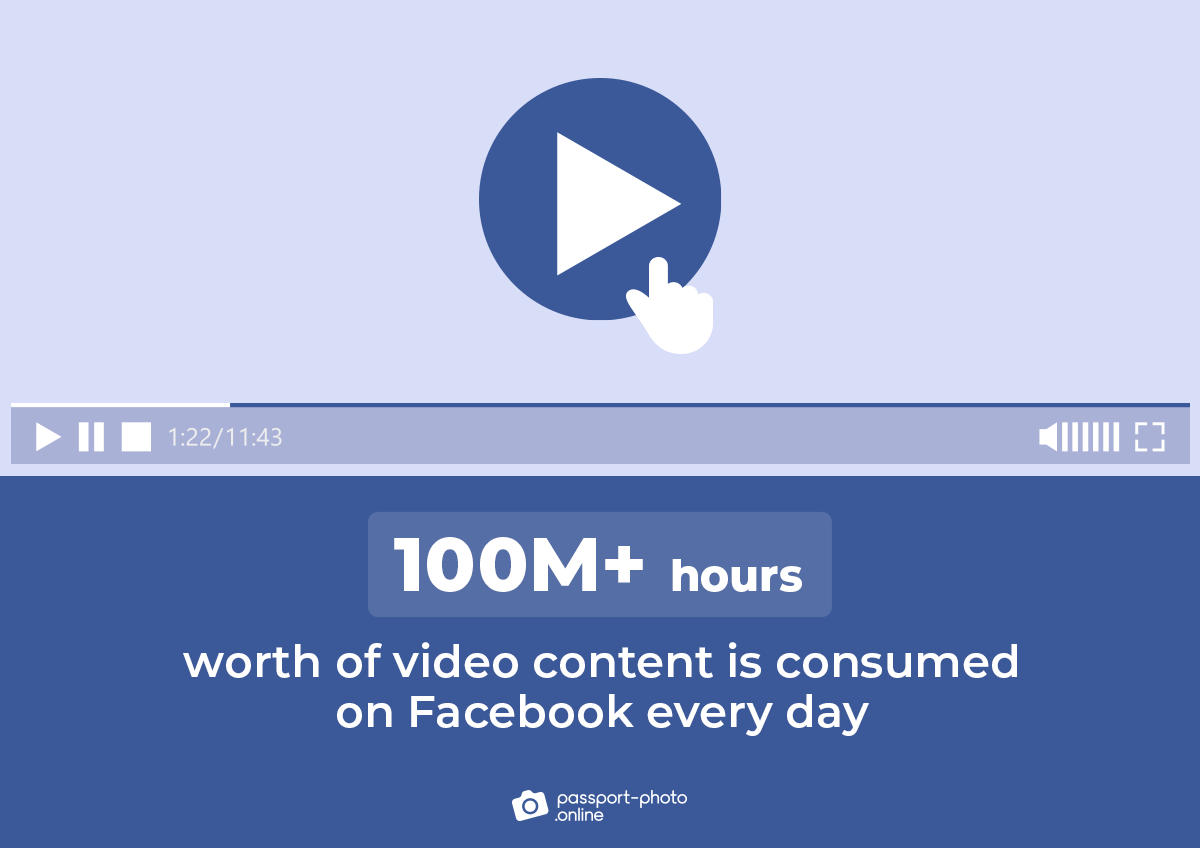
- 100M+ hours worth of video content is consumed on Facebook every day.
- 85% of Facebook videos are played without sound.
- Vertical videos are the most engaging format on Facebook.
- ❤️ (47%) and 😂 (35%) are the most popular emoji reactions to Facebook videos.
The Dark Side of Facebook
- Facebook has 11% of duplicate accounts, and 5% are fake accounts.
- In Q1 2022, Facebook took action on 1.6B fake accounts (down from 1.7B in Q4 2021).
- In the 2nd half of 2021, Facebook received ~60K requests for user information from US law enforcement agencies. Worldwide, that number stood at 425K.
- 4B+ pieces of content were deleted from Facebook due to copyright, counterfeit, or trademark reports in 2021.
- Facebook deletes 33M posts quarterly for sexual content or nudity (on average).
- Facebook has deleted an average of 8.8M threatening or bullying-related content quarterly since 2021.
- Up to 192M posts have been removed from Facebook since 2020 for hate speech.
- Although Facebook allows displaying certain sensitive content under a warning label, 117M of such posts were removed in the past year alone.
- In the 1st quarter of 2022, Facebook noted an increase in user appeals due to deleted posts, especially for reasons of harassment and bullying (736K), spam (39.6K), and suicide or self-harm (6K).
Stacking It All Up
There you go.
An extensive list of Facebook statistics, facts, and trends to help you stay ahead of the curve.
Now—
What’s your take on Facebook? Is it your favorite social media platform today?
Let us know in the comments.
FAQ
Is Facebook the most popular social media platform?
When did Facebook launch?
Which country has the highest number of Facebook users?
How many daily users does Facebook have?
How many Facebook monthly active users are there?
How much time do people spend on Facebook every day?
How old are people on Facebook?
What’s the male-to-female ratio on Facebook?
What do people think about Facebook?
How many times has Facebook been downloaded?
How much revenue does Facebook generate?
Fair Use Statement
Did you like our infographics? If so, feel free to share them with your audience. Just remember to mention the source and link back to this page.
Sources
- Anderson M., Jiang J., “Teens, Social Media and Technology 2018”
- Chevalier S., “Key Figures on Facebook Marketplace and Facebook Shops Worldwide as of 1st Quarter 2021”
- Clement J., “Most Popular Websites Worldwide as of November 2021, by Total Visits”
- Constine J., “You Might Hate It, but Facebook Stories Now Has 500M Users”
- Cucu E., “[Facebook Video Study] What 3,977,410 Video Posts Tell Us About Facebook Video Strategy In 2021”
- Curry D., “Social App Report 2022”
- DataReportal, “Digital 2020 October Global Statshot Report (October 2020) v01”
- Dixon S., “Biggest Revenue Source of Leading Online and Tech Companies in Most Recently Reported Quarter Ending March 2022”
- Dixon S., “Facebook Messenger – Statistics & Facts”
- Dixon S., “Facebook – Statistics & Facts”
- Dixon S., “Most Downloaded Mobile Apps Worldwide from 1st Quarter 2014 to 3rd Quarter 2021”
- Dixon S., “Most Popular Social Networks Worldwide as of January 2022, Ranked by Number of Monthly Active Users”
- eMarketer, “Amazon’s Share of the US Digital Ad Market Surpassed 10% in 2020”
- Enberg J., “Social Media Update Q1 2021”
- Facebook IQ, “How to Unlock Your Creative Potential on Stories”
- Facebook IQ, “Why Stories Is a Format That Can Help Marketers Promote Brands”
- Facebook, “Annual Meeting of Stockholders”
- Forbes “Profile – Mark Zuckerberg”
- Hitlin P., Rainie L., Olmstead K., “Facebook Algorithms and Personal Data”
- Insider Intelligence, “Us Social Network User Growth, by Platform, 2020 & 2021 (% Change)”
- Keutelian M., “The Best Times to Post on Social Media in 2022”
- Lebow S., “Are Facebook Users Weary of the Network’s Video Capabilities?”
- Lebow S., “Where to Reach Livestream Viewers on Social Media”
- Lebow S., ”TikTok Isn’t the No. 1 Us App for Shorter Videos”
- Marketing Charts, “Almost 1 in 3 US Adults Regularly Get News on Facebook”
- Marketing Charts, “Facebook and Instagram Ad Benchmarks for Retailers in 2020”
- Marketing Charts, “Social Media Marketing Update: Preferred Platforms and Content Types in 2021”
- Meta for Business, “Extend the Reach of Video Adverts Through the Audience Network”
- Meta Investor Relations, “Quarterly Earnings”
- Meta Transparency Center, “Notice and Takedown”
- Patel S., “85 Percent of Facebook Video Is Watched without Sound”
- Peters B., “What 777,367,063 Facebook Posts Tell Us About Successful Content in 2019 (New Research)”
- Pew Research Center, “Nearly Half of Americans Get News through Facebook”
- Pew Research Center, “On Facebook, Parents Are Friends with Their Teens”
- Pew Research Center, “Social Media Fact Sheet”
- Statista, “Leading Social Media Platforms Used by Marketers Worldwide as of January 2021”
- Statista, “Most Valuable Brands Worldwide in 2022”
- Statista, “Number of Internet and Social Media Users Worldwide as of July 2022”
- Statista, “Planned Changes in Use of Selected Social Media for Marketing Purposes Worldwide as of January 2022”
- The Manifest, “How Social Media Can Help Businesses Win Loyal Customers”
- United States Census Bureau, “US and World Population Clock”
- US Department of Commerce, “US Population Estimated at 332,403,650 on Jan. 1, 2022”
- Vogels A., Auxier B., Anderson M., “Partisan Differences in Social Media Use Show Up for Some Platforms, but Not Facebook”
- Walker M., Matsa K., “News Consumption Across Social Media in 2021”
- Wikipedia, “List of Mergers and Acquisitions by Meta Platforms”

Alejandro is a writer with 5+ years of experience. He graduated in English philology and holds an MA in Multilingual and Intercultural Communication. In his spare time, he improves recipes, seeking to delight his tastebuds.