Ready to dive into the world of hotel industry statistics?
You’ve come to the right place.
We’ve curated and vetted a list of up-to-date statistics and organized everything into categories to help you quickly find the information you need.
Let’s get started:
Top Hotel Industry Statistics (Editor’s Picks)
- There are over 187,000 hotels worldwide.
- The global hospitality market was valued at $5.54T in 2024 and is projected to reach $21.28T by 2033, growing at a 16.13% CAGR.
- The global hotel market revenue was projected to reach $455.15B by 2025.
- The global hotel and tourism industry’s average operating profit margin rose from 19.24% in Q4 2024 to 19.99% in Q1 2025.
- In September 2025, Europe recorded the highest hotel occupancy rate at 75%, while the Americas had the lowest at 65%.
- Las Vegas boasts the highest number of hotel rooms among US cities, with 169,100.
- There were 45,745 hotel and motel businesses in the US in 2024, up 2.4% from 2023.
- In 2024, the hotel and resort sector worldwide was valued at $1.7T, reflecting about 7% growth from the previous year’s $1.59T.
- Sole proprietorship hotels in the US generate an average annual revenue of $94,464.
- The US hotel sector’s ADR was projected to rise from $145 in 2022 to $155 in 2024.
- Many travelers (81%) want better digital customer service from hotels.
- Seven in 10 Millennials are likely to book holiday accommodation that uses mobile payments, smart TVs, keyless entry, or other tech amenities.
- 59% of travelers claim they are willing to pay extra to ensure their trips are more eco-friendly.
- Hotels that utilize virtual tours are experiencing a significant revenue boost, up to 135%.
General Hotel Industry Statistics
- Hilton was the world’s most valuable hotel brand in 2024, with a brand value of nearly $11.6B.
- Wyndham Hotels & Resorts tops the list of hotel companies by property count, with 9,178 units in its global portfolio as of June 2024.
| Leading Hotel Companies Worldwide by the Number of Properties (As of June 2024) | Number |
| Wyndham Hotels & Resorts | 9,178 |
| Marriott International | 8,861 |
| Hilton | 7,682 |
| Choice Hotels International | 7,486 |
| BWH Hotel Group | 3,910 |
| IHG Hotels & Resorts | 2,079 |
- The hotel segment is expected to have 1.33B users by 2027.
- User penetration is projected to rise from 17% in 2025 to 22.9% by 2030.
- Online sales are expected to account for 81% of the hotel segment’s total revenue by 2030.
- The US hotel market revenue is projected to reach $119.97B by 2025.
- In Forbes’ 2025 Global 2000 ranking, Marriott International led all hotel and resort chains with a market value of about $65B, followed by Hilton Worldwide at $52.6B.
- The US hotel industry’s RevPAR (revenue per available room) stood at $110.37 in July 2025.
- As of Q1 2024, the United States had the highest number of hotel projects in the pipeline: 2,272. It’s followed by China, with 1,688 projects.
- The travel and tourism industry contributed around $11T to the world’s GDP in 2024.
- Booking Holdings, Inc., a major player in the online travel industry, has a net worth of $160.9B as of November 5, 2025.
- In 2024, Marriott had about 1.6M guestrooms worldwide, which is roughly 400,000 more than Hilton, making it the world’s largest hotel company by number of guestrooms.
- The global smart hospitality market was valued at $22.88B in 2024 and is expected to grow at a 29.79% CAGR through 2034.
- The US hotel industry’s average daily rental revenue per occupied room stood at $158.67 in 2024.
- Forbes ranked Marriott International as the top hotel and resort chain in 2025, with approximately $25.1B in sales over the 12 months to April 2025.
- Data security concerns 39% of hotel executives, with 28% being very concerned.
- The bleisure market stood at $709.2B in 2024 and could reach $4,219.5B by 2034.
Fun Facts about the Hotel Industry
- Istanbul, Turkey, is home to the most 5-star hotels, with 201 establishments.
- The First World Hotel in Malaysia has been the largest hotel in the world since 2020, with a total of 7,351 rooms across two buildings.
- California, Texas, and Florida are the top three states with the highest number of hotels and motels, with 15,557, 14,733, and 9,410 businesses, respectively.
- Nearly nine in 10 guests (87%) have admitted to taking something from a hotel room at least once.
- Towels, soap dishes, and tissue boxes are the top three items stolen from hotels, each taken by around 35% of guests.
- With 7,351 rooms, The Venetian Resort is the biggest hotel in the USA.
- Nishiyama Onsen Keiunkan, in operation since 705, is widely regarded as the oldest hotel in the world.
- The oldest hotel in the United States is Hotel El Convento, which has its roots in a Carmelite monastery dating back over 365 years.
- Ellsworth Milton Statler opened the first American hotel chain in 1901 with the Statler Hotel in Buffalo, NY. The chain grew to over a dozen properties and was acquired by Hilton Hotels in 1954.
- The Royal Mansion at Atlantis The Royal in Dubai is widely regarded as the world’s most expensive hotel suite, with a nightly cost of approximately $100,000.
- Ciel Tower, located in Dubai, holds the title of the world’s tallest hotel, standing at 1,237 ft (377 m) and comprising 82 floors.
- In October 2024, the mean price for a hotel room in Miami was $320.
- Hotel brands that use high-quality images on their site enjoy a 15% conversion rate boost compared to those that use low-quality or minimal photos.
- Third-party booking services take a 10–22% cut of hotels’ revenue, with larger chains losing 10% to 15% and smaller hotels losing 18–22%.
Sustainability in the Hotel Industry
- Over the last two years, 60% of people have stayed at a hotel with sustainable practices.
- Most tourists (70%) are willing to spend more on sustainable accommodation, with the most common amount being an additional “16–20%.”
- Booking.com has awarded a Travel Sustainable badge to over 100,000 properties worldwide for their sustainability initiatives.
- Nearly eight out of 10 leisure travelers prioritize water conservation, with 27% believing hotels should offer guests the option to opt out of daily cleaning and towel change services.
Hotels & Motels in the US: Employment Statistics
- In 2024, 1,550,906 people were employed in US hotels and motels. Employment in the sector grew at an average annual rate of 3.5% from 2019 to 2024.
- The typical US hotels and motels business employs 33.9 people.
- The mean annual salary for a hotel desk clerk in the US is ~$29,851 per year ($14/hour).
- In August 2025, the hotel industry had a 6.4% unemployment rate.
- Roughly 68% of hotel executives plan to incorporate new technologies to attract and retain staff.
Hotel Guests Statistics
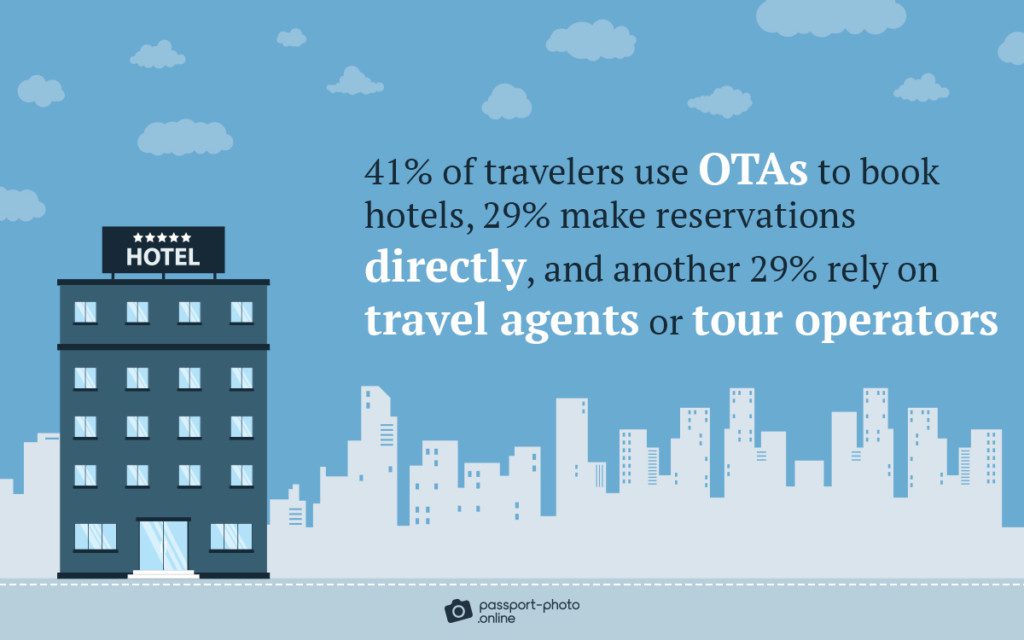
- About 41% of global travelers use OTAs (online travel agencies) to book hotels, 29% make reservations directly, and another 29% rely on travel agents or tour operators.
- Nearly 40% of hotel guests are inclined to write a review if they have a positive experience. In comparison, 48% are more likely to do so after a negative experience.
- Most users read 6–12 reviews on TripAdvisor before deciding on a place to stay. Recent reviews are especially valuable, with 80% of respondents prioritizing them.
- The average global hotel stay lasts between 1.8 and 2.2 days, varying by region and hotel type.
- Most travelers (80%) value the ability to easily change or cancel their reservations.
- Close to 56% of travelers are concerned about the privacy and security of their data provided to hotels, while 20% are highly concerned.
Keep Exploring
Want more data? Here are additional resources:
- Fun Facts About Traveling
- Cruise Industry Statistics
- Interesting Facts About Airplanes & Air Travel
- Vacation Sex Statistics
- Solo Travel Statistics and Facts
- Adventure Tourism Statistics
- Stats on How Social Media Affects Travel
- Tourism in Europe Statistics
- Business Travel Statistics
- US Tourism Statistics
- Online Travel Bookings Statistics
- Digital Nomad Statistics
- Airline Industry Statistics
- International Tourism Statistics
- Bleisure Statistics
- Vacation Rental Statistics
- UK Tourism Statistics
- Airbnb Statistics
- Travel Statistics
- Workation Statistics
- Sustainable Travel Statistics
- Tripadvisor Statistics
Sources
- American Hotel & Lodging Association, “Surveys: Most Americans More Likely to Stay in Hotels”
- Booking.com, “Climate, Community and Choice: Booking.com Reveals the Trends Shaping Sustainable Travel”
- Booking.com, “Sustainable Travel Report”
- CompaniesMarketcap, “Booking Holdings (Booking.com) (BKNG) – Market Capitalization”
- Construction Review, “Top Ten Largest Hotels in the United States of America (USA)”
- CoStar, “STR: US Hotel Rate, Revenue per Available Room Improve in September”
- Daily Mail Online, “London Loses Its Crown as the World’s 5-Star Hotel Capital in the Forbes Travel Guide Rating”
- Diosi D., “How People Book Hotels? Fresh Research Data Reveals Interesting Insights”
- FRED, “Unemployment Rate – Leisure and Hospitality, Private Wage and Salary Workers”
- Future Market Insights, “Bleisure Tourism Market Demand, Sales, Trends & Forecast 2033”
- Grucela A., “Here’s What We Usually Steal from Hotels”
- Hospitality Net, “Hotel Guests Read 6–12 Reviews before Booking, Says New TripAdvisor Survey”
- Hotel Technology News, “Research: 78% of Hoteliers Will Increase Their Investment in Hotel Technology in the Next Three Years”
- IBISWorld, “Hotels & Motels in the US – Employment Statistics 2005–2029”
- IBISWorld, “Hotels & Motels in the US – Number of Businesses”
- Keiser D., “The Hotel Business in America Has a Long and Sometimes Even Illustrious History”
- MacroTrends, “Booking Holdings Net Worth”
- Market Data Forecast, “The State of the Hospitality Market | Size, Growth | 2023 – 2028”
- Morning Consult, “Travel Outlook”
- O’Keefe A., “10 of the Most Expensive Hotels in the World”
- Oldest.org, “10 Oldest Hotels in the World”
- Oldest.org, “8 Oldest Hotels in America”
- ReviewTrackers, “Stats Proving the Value of Customer Reviews”
- SiteMinder, “SiteMinder’s Hotel Booking Trends: New Analysis of 100 Million Reservations Shows Surge in Global Traveller Confidence”
- Statista, “Airbnb Market Cap Worldwide”
- Statista, “Average Number of Rooms per Hotel in the United States, by Chain Type”
- Statista, “Countries with the Most Hotel Constructions Worldwide”
- Statista, “Forecast Average Daily Rate of Hotels in the United States”
- Statista, “Forecast Occupancy Rate of Hotel Industry in the United States”
- Statista, “Forecast Revenue per Available Room (RevPAR) of Hotel Industry in the United States”
- Statista, “Hotel Brands That the Public View the Most Positively in the United States”
- Statista, “Hotel Guest Technology Preferences for Check-In/Out Worldwide”
- Statista, “Hotel Industry Worldwide Statistics & Facts”
- Statista, “Hotels – Worldwide”
- Statista, “Revenue per Available Room (RevPAR) of Hotel Industry in the United States”
- Statista, “Largest Hotel and Resort Companies Worldwide”
- Statista, “Leading Hotel Brands Based on Brand Value Worldwide”
- Statista, “Leading Hotel Companies Worldwide, by Number of Guestrooms”
- Statista, “Leading Hotel Companies Worldwide, by Number of Properties”
- Statista, “Operating Profit Margin of the Hotel and Tourism Industry Worldwide”
- Statista, “Selected Cities with the Most Expensive Hotel Rates in the United States”
- Statista, “Share of the Total Gross Domestic Product (GDP) Generated by Travel and Tourism Worldwide”
- Univers Labs, “The Importance of Imagery on Hotel Websites”
- Wikipedia, “List of Largest Hotels”
- Wikipedia, “List of Tallest Hotels”
- Woolf M., “Is Sustainable Travel Trending up?”
- Woolf M., “The Growing Trend of ‘Work From Hotel’”
- ZipRecruiter, “Salary: Hotel DESK Clerk; United States”

As a Digital PR specialist and a member of the Society of Professional Journalists (SPJ), Max has 5+ years of writing experience.
Over the course of his career, Max’s work has garnered significant attention, with features in numerous prominent publications such as The New York Times, Forbes, Inc., Business Insider, Fast Company, Entrepreneur, BBC, TechRepublic, Glassdoor, and G2.


